
Over the past couple of days, U.S. housing produced two good reports for the month of May.
Monday, existing home sales were published, coming in at a seasonally adjusted annual rate of 5.35 million units – up 5.1 percent month-over-month and 9.2 percent year-over-year. The May count was the third consecutive month of north of five million units and was the strongest since 5.38-million units in July 2013 (Chart 1). The 12-month rolling average of 5.06 million was the strongest since December 2013. The trend is going the right direction.
The same holds true with new home sales, which were out yesterday. Sales of 546,000 units (SAAR) were up 2.2 percent m/m and 19.5 percent y/y. They were the highest since February 2008, even as the 12-month rolling average of 482,000 was the highest since December 2008. Sales for the prior three months were all revised higher.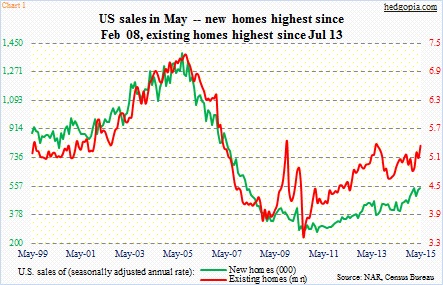
Housing bulls could not have asked for more.
Yet, housing stocks have failed to respond with the kind of fervor one would normally expect on the back of such good data. For the week, ITB, the iShares Home Construction ETF (27.70), is up 1.1 percent. Tuesday, it was up a mere five cents. Both Monday and Tuesday produced dojis – right outside the upper Bollinger Band.
Obviously, it did not seem like shorts were rushing to cover. As of end-May, short interest on ITB had already dropped to 13 million from 15.2 million at the end of April. That was when the ETF bottomed before pushing higher, squeezing the shorts in the process (arrow in Chart 2). A squeeze also took place when short interest declined from 15 million at the end of January to 11.4 million two months later, and the ETF jumped from 25.32 to 28.23.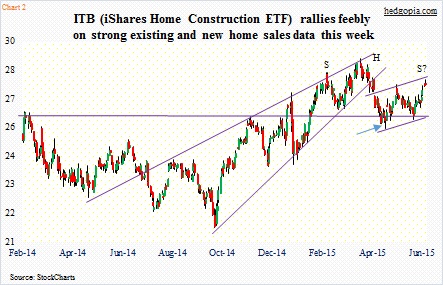
No such thing this time around. The inability of bulls to cash in on two sets of encouraging data this week speaks volumes about how trading in ITB might go in the near-term.
One can argue that the ETF was responding more to how 10-year Treasury notes were acting. Yields have already risen 14 basis points this week, to 2.41 percent. The 10-year was yielding 1.65 percent in January. Mortgage rates have followed suit. The 30-year fixed mortgage rate has risen from 3.67 percent in April to 4.1 percent. That is quite a jump in two short months. The spike can be seen in two green bars on the right side of Chart 3.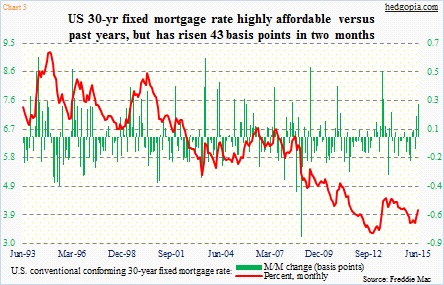
Versus history, current mortgage rates compare very favorably. But more often than not, it is the speed in the change of rates that matter more than the level. This is particularly so today as the zero interest-rate policy has prevailed for six-plus years.
Of note, in December through May, 30-year mortgage rates were under four percent. This probably played a role in igniting sales of both new and existing homes the past few months. Rates bottomed in April, and have since risen 43 basis points.
This is probably why ITB has not favorably responded to the data this week. It is looking ahead – trying to divine how the recent spike in rates might impact sales in June and beyond.
Given all this, the ETF is probably looking to rest near-term. Technically, it is bumping against the upper end of a two-month channel. Even more ominous, if it retreats from here, it would have formed the right side of a head-and-shoulder formation (Chart 2). In this scenario, the 26-plus support takes on added importance.
How to play it, then?
Weekly July 2nd in-the-money 27.50 calls are selling for $0.38. Hypothetically, a naked call ensures either a short position at 27.88 or decent income generation. The high yesterday was 27.89.
Thanks for reading!
