
- Bears point to action in transports to drive point home
- Bulls cite how financials are acting to prove why bears are wrong
- VIX remains pinned by 15, bullish (financials); VIX past 15, bearish (transports)
Much ink has been spilled over how U.S. transport stocks have been severely underperforming stocks in general. The Dow Jones Transportation Average peaked late November last year, then proceeded to trade within a declining channel, which it briefly fell out of toward the end of May. In the meantime, it has lost crucial support at 8550-8600 (Chart 1).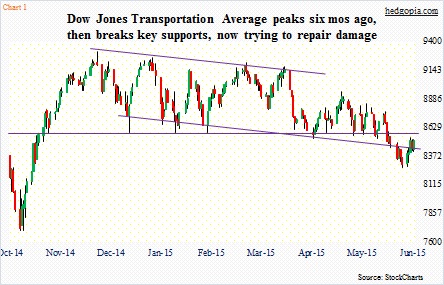
Nonetheless, for followers of the Dow Theory, which combines the Transportation Average and the Dow Industrials to look for signs of divergence between the two, there is no sell signal yet. The latter is yet to break support at 7600.
Off the lows six sessions ago, the Transportation Average (8509.64) has rallied three percent, and currently sits right underneath that horizontal resistance. With the recent rally, daily momentum indicators are approaching the median of the range. If this rally is just an oversold bounce, then this is a perfect stop for momentum to turn back down. It is a show-me time for the bulls. If they can reclaim that support-turned-into-resistance, the near-term picture would have improved. Weekly momentum indicators are way oversold.
This is one side of the equities coin. And it does not quite portray a healthy picture.
Enter financials, and we see the other side of the coin – a healthy one.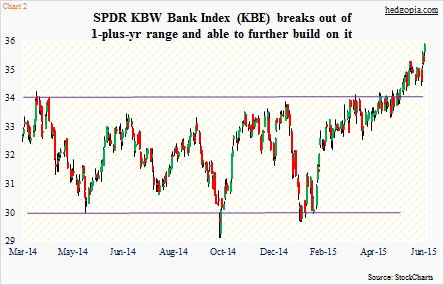
Chart 2 shows the price action in KBE (35.99), the SPDR KBW Bank Index. It broke out of a one-plus-year range a month ago. Just looking at that breakout, a technican can come up with a measured-move target of 38. It is halfway there. On the coattails of a 31-basis-point surge in the 10-year Treasury yield last week, the ETF shot up three-plus percent. A steepening yield curve is good for banks and brokers. It has nearly 78 percent exposure to regional banks. This is also the reason why it closely mirrors KRE, the SPDR KBW Regional Banking Index.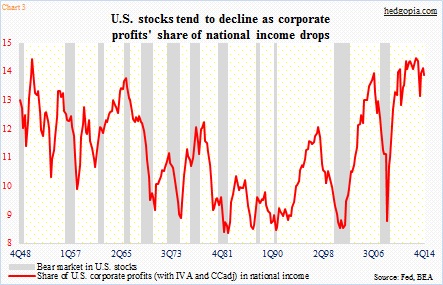
So which one of these two is signal and which one is noise? If transports are right, stocks in general are headed for trouble. Not so if financials are sending the right message. In the former in particular, several indicators, one of which is shown in Chart 3, look overstretched. The red line represents the share of corporate profits in national income. In the past, stocks have not liked when the line begins its journey down from extended levels.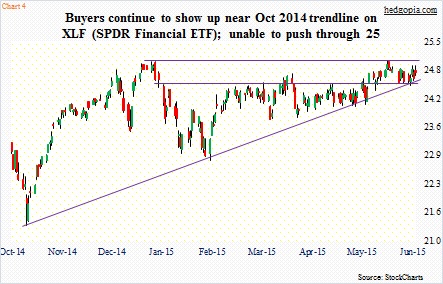
One thing, though. The knock on financials’ rally is that they are not all rallying with the same intensity. XLF (24.79), the Financials SPDR ETF, is lagging KBE; the former assigns the most weight to the leading financials. The top three weights go to WFC (8.7 percent), BRK.B (8.5 percent) and JPM (8.1 percent). The ETF has been unable to break out of 25 and change, which stopped the advance twice – late December and mid-May. The good thing is, the October 2014 trendline is intact (Chart 4).
So what will break the logjam between transports and financials, and their respective signals? VIX, anyone?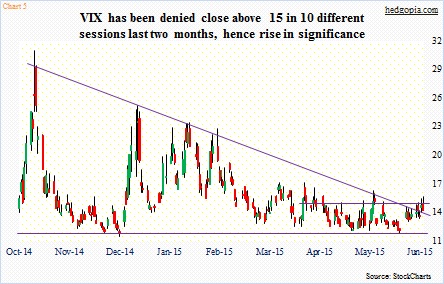
The Volatility Index has attempted to rally past 15 for over two months now, and has been denied a close above that level 10 times, three of which were just last week (Chart 5). There is a real tug of war going on between volatility bears and bulls.
Based on VIX action last week, equity bulls have an opportunity to push volatility lower in the very near-term. Which, if transpires, may just be enough to push the Transportation Average through resistance and XLF through 25. For this scenario to come to pass, VIX should continue to move lower to sideways, and the 15 resistance holds. This is a cheerful scenario.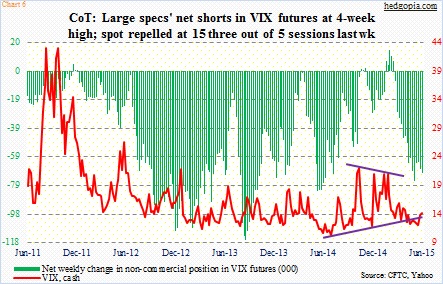
But it does not take much to push VIX past 15. It is right there. Should that transpire, three different resistance levels would have been won over: (1) October 2014 declining trendline, (2) 200-day moving average, and (3) two-month-plus resistance at 15. In this scenario, non-commercials have a bunch of net shorts in VIX futures that will need unwinding (Chart 6).
The longer this wait-and-see game continues, the subsequent move in VIX can be fast and furious.
Thanks for reading!
