
The saga continues. VIX (13.66) continues to get sold off around 15.
Since April, intra-day the so-called fear index has traded above 15 nine times, and only once has it been able to close out above (Chart 1). That was April 1, but it closed under 15 the very next session. The latest attempt was Tuesday; 15 was tagged, and that was it. Now it is sitting right on its 50-day moving average.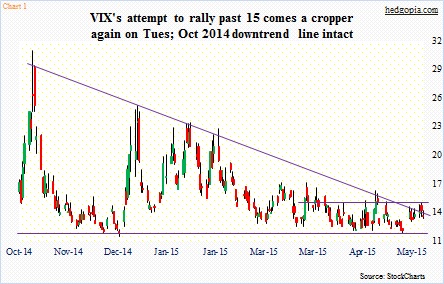
One of the reasons why this level has been so tough to crack is that it approximates the 200-day moving average (15.16). That has been the case the last three months. As well, if the early rally attempt on Tuesday held, then it would have broken out of the trendline that has stopped each spike since the middle of October.
So a break out of 15 will have taken care of three things: (1) October 2014 trendline, (2) 200-day moving average, and (3) nearly-three-month resistance at 15. The longer the status quo remains, the more it remains coiled.
The last time the ratio of VIX to VXV reached the upper end of its range was in January this year (Chart 2). So it has been a while.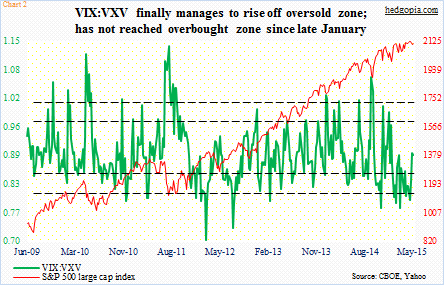
Also noteworthy is the fact that VIX has only traded below 12 once so far this year – on May 22nd. This is probably a reason why year-to-date it has averaged higher than comparable periods in both 2014 and 2013 – 15.3 versus 14.6 and 13.7 respectively. Although volatility was much higher in 2011 or 2012.
The rise in volatility this year is true across the term structure. Chart 3 plots year-to-date volatility for VXST, which measures nine-day volatility using S&P 500 options, VIX (goes out a month), VXV (three months) and VXMT (six months) for 2015 and compares that with comparable volatility in the previous four years.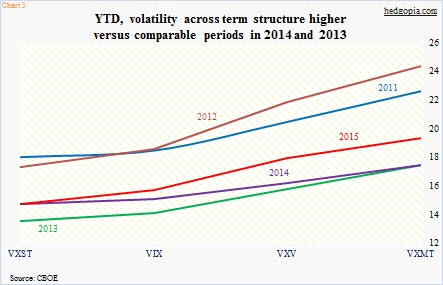
This year, volatility has clearly shifted up compared to the last two years. Once again, it remains substantially below what it was in 2011 and 2012. The latter two were volatile times. But the interesting thing this year is that equities are sitting near all-time highs. Volatility is not as suppressed as it looks at first glance.
Beneath the surface, people are hedged for downside risk. For example, on SPY, the S&P 500 SPDR ETF, implied volatility for five-percent out-of-the-money August calls is nine percent, versus 17 percent for comparable put options.
Thanks for reading!
