
- U.S. wages stuck in mud, more so for supervised employees than for supervisory
- ECI for private sector has been trending higher since 1Q14; sustainable?
- Productivity crucial for employers’ ability to absorb wage hikes
If there is one consistency in the current U.S. recovery, it is the lack of progress as relates to wages. Year-over-year growth in average hourly earnings of private employees has consistently been capped at two-plus percent (Chart 1). The April jobs report was not an exception, coming in at 2.2 percent. Earnings for production and non-supervisory employees only grew 1.9 percent.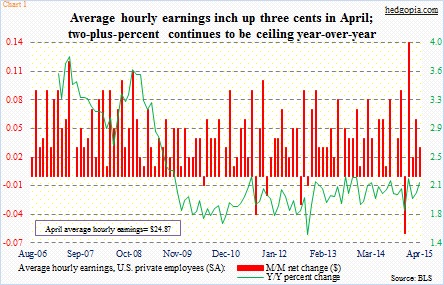
There is a yawning gap in earnings between the supervisor and the supervised. Chart 2 plots the difference between earnings of all private-sector employees and those earned by production and non-supervisory employees. The latter makes up some 80 percent. In the chart, since late 2010, the red bars have been gaining in height; the supervisory employees have been increasingly taking a bigger share of the wages pie.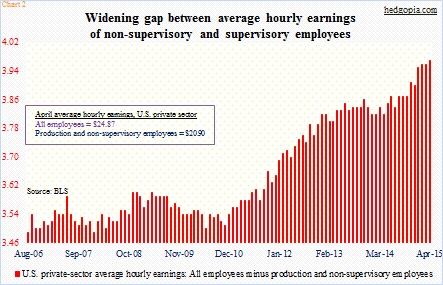
This probably should not come as a surprise given the amount of slack out there. Sure, the unemployment rate has been nearly cut in half from the November 2009 peak of 9.9 percent; April inched lower month-over-month to 5.4 percent. But, that probably owes as much to job creation as to those leaving the labor force. The ‘not in labor force’ category has surged from 80.9 million in June 2009 to 93.2 million in April.
The ‘employed part time for economic reasons’ category dropped to 6.6 million in April, but remains high, given the drop in the unemployment rate. These are people that work part-time but involuntarily. In normal times, the red and green lines in Chart 3 tend to move hand in hand. Not so this cycle. They have diverged for four years now.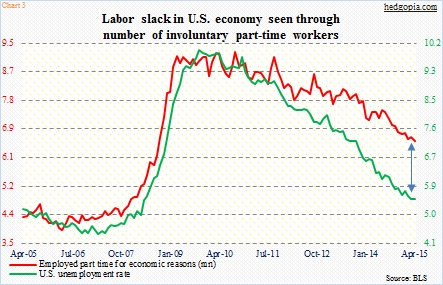
As has the relationship between year-over-year growth in average hourly earnings of production and non-supervisory employees and the compensation plans of National Federation of Independent Business members. The latter tends to lead the former by six to nine months. In Chart 4, the green bars began diverging from the red line in the middle of last year (blue arrow). The red line kept rising, but the green bars went the other way. Now, the comp plans are beginning to weaken – March was 13, down from 17 in December. Too soon to say if it is a signal.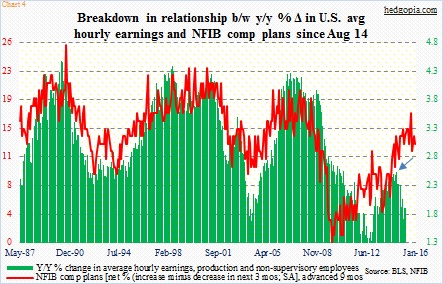
In recent months, there have indeed been encouraging news from corporate America, as companies ranging from WMT to AET to TGT have announced plans to hike wages.
As well, the employment cost index for the private sector is trending higher (Chart 5). As opposed to the average hourly earnings, the ECI includes both wages & salaries and benefits. In 1Q14, wages & salaries, benefits, and total comp each grew 1.7 percent, 1.8 percent and 1.7 percent, respectively, year-over-year. One year later in 1Q15, they grew 2.8 percent, 2.6 percent and 2.8 percent, in that order.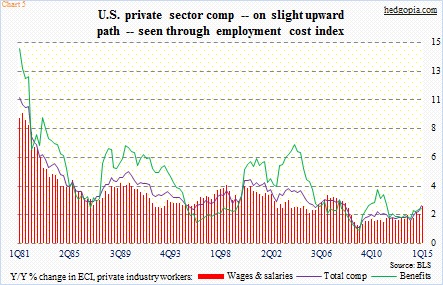
Of course, the question is, can the momentum continue?
Ultimately, it all boils down to productivity. Chart 6 plots year-over-year growth in output per hour, hourly comp, and unit labor costs. Roughly speaking, unit labor costs, expressed in percent change, are equal to wages minus output per hour. (The ECI includes both wages and benefits. Unit labor costs goes one step further, as it also includes such things as stock options.)
Hence the higher the productivity, the easier it is for employers to give a raise, and vice versa. Unfortunately for U.S. workers currently, productivity is dismal. In 2014, non-farm productivity was a mere 0.71 percent, preceded by 0.85 percent in 2013, one percent in 2012 and 0.16 percent in 2011; both 2009 and 2010 were three-plus percent.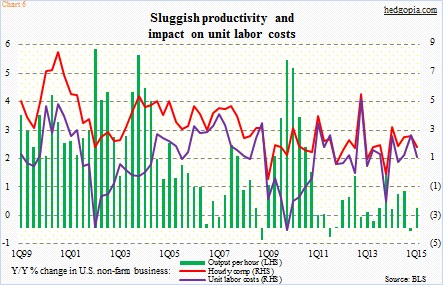
On a quarterly basis, the drop in output per hour is represented by the gradually shrinking green bars in Chart 6. In 4Q14, productivity shrank 0.08 percent, and hourly comp rose 2.51 percent; as a result, unit labor costs jumped 2.59 percent. As far as employers are concerned, this is not a good mix. In 1Q15, hourly comp rose 1.72 percent, but because productivity rose 0.64 percent, unit labor costs only rose 1.07 percent.
When it is all said and done, it probably matters less what NFIB members say their comp plans are or how low the unemployment rate goes. If companies have not invested enough in capital projects – which is the case now – productivity takes a hit, and with that companies’ ability to absorb wage hikes.
Thanks for taking the time to read this post.
