
Within a month, RVX, the Russell 2000 Volatility Index, has gone from 17.34 to 46.66 to now back down to 23.70. Volatility has been very volatile.
Going back to early 2013, RVX has found support at 14, consistently rising off of this level – trampoline-like. At the same time, it also consistently found difficult to sustain above 30. This changed last month, thanks to a five-session, 169-percent jump.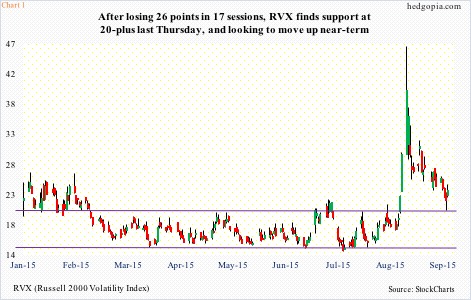
Rather discouragingly for volatility bulls the August 24th spike was fleeting. From that peak to the low last Thursday of 20.56, RVX dropped nearly 56 percent. Here is the good. On Thursday, it bounced off support (Chart 1), in the process saving the 50-day moving average. The path of least resistance near-term is probably up.
In this scenario, IWM, the iShares Russell 2000 ETF, should come under pressure. And it is beginning to show up in the chart. On Thursday, it retreated after nearly tagging the declining 50-day moving average. The high in that session was $118.89 and closed Friday at $115.72.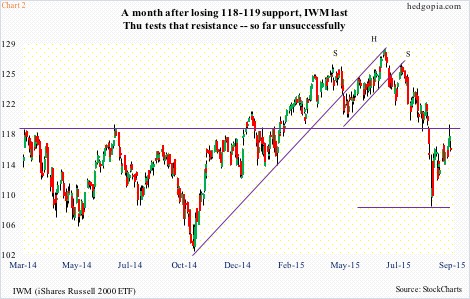
Resistance at $118-$119 goes all the way back to March last year (Chart 2). Early February, it broke out, then proceeding to add 10 points in the next four-plus months. Come August, that support – also the neckline of a head-&-shoulders formation – was lost. Last week, the ETF tried to retake that level, only to suffer a quick reversal. Sellers appeared exactly where they could possibly have.
On a daily chart, momentum indicators are now coming under pressure. The path of least resistance is down. The only question is if possible weakness is temporary or persists over the medium-term.
Small-cap bulls, if they can regroup, can take advantage of rather large short interest on IWM. In the past five months, it has risen from 97.3 million to 128.2 million (Chart 3). Although it is substantially below the mid-October 2014 high of 155.3 million, when the Russell 2000 bottomed, squeezing the heck out of shorts.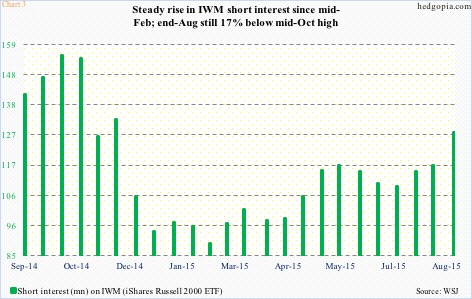
Similarly, non-commercials continue to maintain rather large net shorts in Russell 2000 futures. As of last week, they totaled 34,426 contracts, down from 46,064 a month ago but versus net longs of 10,175 12 weeks ago (shown here). Once again, in the right circumstances, if forced to unwind, these holdings can be a tailwind for the index.
Not in the near-term. Not this week at least – if we are to trust how market participants have positioned themselves in the options market. There is a heavy concentration of at/near-the-money puts in IWM’s September 25th expiration (Chart 4).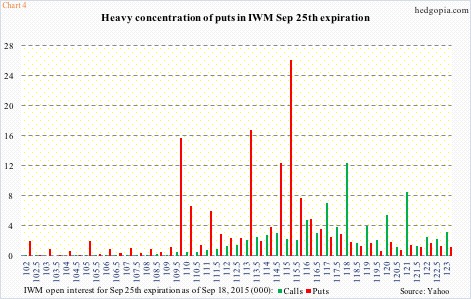
The action post FOMC-decision last week has probably emboldened the bears, and, as things stand now, the ball is theirs to fumble.
Hypothetically, selling September 25th weekly 117 calls bring $0.79. If the ETF rallies 1.5 percent this week, it is an effective short at $117.79. Naked calls are risky, but in this case risk-reward probably favors the latter as the trade goes short near the afore-mentioned resistance.
Thanks for reading!
