
When VIX (12.22), the S&P 500 Volatility Index, spiked past 20 nine sessions ago, there was a lot of chatter as to if this time the breakout was real. It was not. In the subsequent eight sessions since that peak, volatility collapsed 42 percent. With it, VIX fell back under the mid-October 2014 declining trend line as well as both its 50- and 200-day moving averages.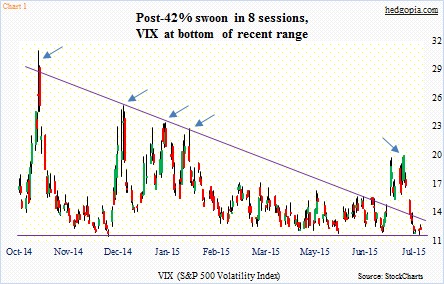
Back in the middle of October last year, as VIX spiked and retreated, that marked an important bottom in U.S. stocks. VIX’s subsequent attempts to rally consistently got repelled by that trend line. So late June, when it broke out, this had the potential to be an important event. Unfortunately for equity bears, they could not quite latch on to the opportunity. The VIX spike turned out to be just that – a spike followed by a quick retreat, as had been the case several other times in the past (arrows in Chart 1). This lit a fire under stocks.
Intra-day, between the July 7th low and July 20th high, SPY (211.76), the S&P 500 SPDR ETF, rallied 4.4 percent. In 10 sessions! For the third time in the past couple of months, the ETF found itself testing resistance at the $212.50 area. Monday, it tried to break out, made an intra-day high of $213.18, but could not quite hold on to it, in the end producing a doji at resistance (Chart 2).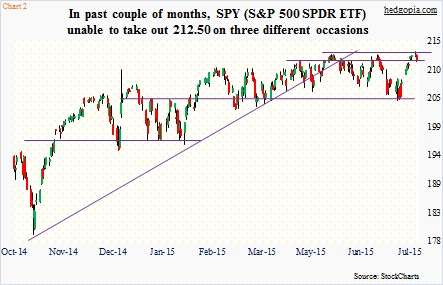
This is a good opportunity for the bears. Daily momentum indicators on SPY are overbought and are already pointing down. That doji on Monday was also formed right underneath the upper Bollinger Band. Concurrently, VIX broke 12 on Monday, before rallying back a little, and is at support.
Odds favor SPY weakens here – at least near-term. In this scenario, bulls would have lost a great opportunity to hurt shorts.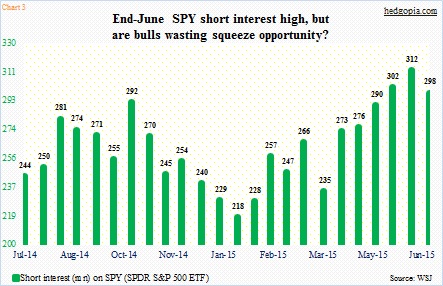
At the end of June, short interest on SPY stood at 298 million, down 4.6 percent from the mid-June high (Chart 3). Incidentally, the end-June total is higher than what it was in the middle of last October. One crucial difference between now and then is that the S&P 500 Index (2119.21) was 300 points lower back then. In the meantime, earnings leave a lot to be desired. Operating earnings for S&P 500 companies dropped year-over-year in both 4Q14 and 1Q15; 2Q15 will meet the same fate if earnings come in as expected (currently $28.53). As well, estimates have persistently gotten worse. At the end of September last year, 2015 operating earnings estimates for S&P 500 companies stood at $136.07; as of the 16th last week, this had collapsed to $115.27. This is a headwind.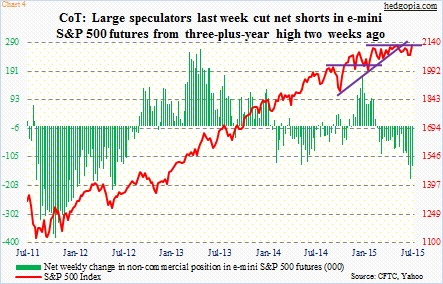
This is probably one reason why SPY’s short interest is as high as it is. As is non-commercials’ net shorts in S&P 500 Index futures. As of Tuesday a week ago, they held 135k contracts, down from a three-plus-year high of 180k two weeks ago, but still sizable (Chart 4). We will find out this week if these traders were forced to unwind their shorts. But the odds of a real squeeze would have only risen if SPY broke out. That has not happened – and increasingly looking less likely given overbought conditions.
This is probably setting up well for call writing. Weekly July 31st SPY 212.50 calls fetch $1.06. These are naked calls, so obviously the intention is to go short if exercised. Should SPY rally, it is an effective short at $213.56.
Thanks for reading!
