
Gold continues to act as if it expects a hike as soon as this month. The FOMC meets on the 16th-17th. On Friday, post-August jobs report, GLD, the SPDR Gold ETF, shed 0.3 percent. The two-year Treasury yield was unchanged at 0.71 percent, even as the 10-year gave back five basis points to 2.13 percent. Two-year notes tend to be sensitive to market expectations for the fed funds rate.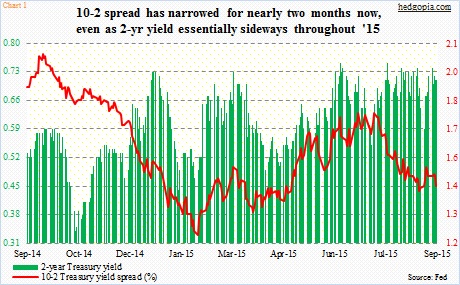
It is interesting how two-year yields have persisted in the 0.7-percent range throughout this year. In the middle of October last year, it was yielding 0.34 percent, rising to 0.73 percent toward the latter days of 2014, and have since essentially gone sideways (Chart 1).
Even as the two-year seems to be expecting a hike, the yield curve is sending a different message. The 10-2 spread (difference between 10- and 2-year Treasury yields) has persistently narrowed the past couple of months. The long end of the curve is worried… does not seem excited by prospects of a rate hike.
Gold for now is responding to the message coming out of the shorter end of the curve.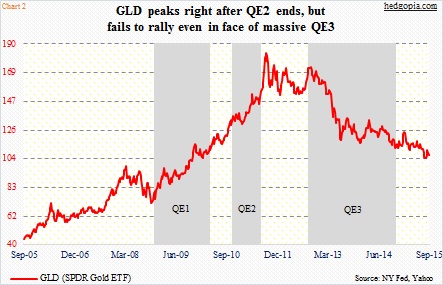
As well, the metal gave the cold shoulder to Mario Draghi’s, European Central Bank president, comments a day earlier. Mr. Draghi said the current program of €60 billion/month asset purchases are intended to run until the end of September 2016, or beyond, if necessary. That is as good a hint as any that more stimulus might be on the way. One would think gold would rally on this, it did not. It is worth recalling that the metal peaked in September 2011, a couple of months after QE2 ended in the U.S., but never got going once QE3 started in September 2012 (Chart 2).
With that said, GLD’s daily chart last week did look like it was itching to go lower in the near-term. If it is just technicals that are dictating the price action near-term, then it is not much of a concern. In fact, non-commercials have indeed been adding to net longs in gold futures – up north of 48,000 contracts in the past five weeks (Chart 3).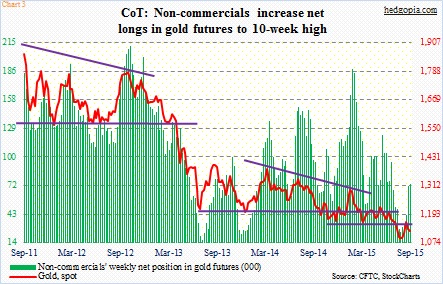
But then again, resistance is holding on GLD. In the first couple of sessions last week, the ETF did try to rally but got rejected on Tuesday at – you guessed it – the 110 region. The resistance goes back to November last year (Chart 4). GLD is back below its 50-day moving average. 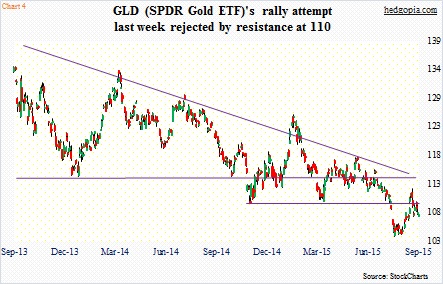
Once again, if gold is living in fear of a rate hike in the upcoming FOMC meeting, then this fog would not be lifted until the 17th. As have been the right strategy the past several weeks, covered calls may still be the way to go.
To recall, July 17th 111 puts were hypothetically sold for $0.60 on July 7. Post-assignment, it was an effective long at $110.40. This was then followed by four weekly covered calls, including one last week, earning a combined $3.11. The effective cost dropped to $107.29.
The choice for the longs is two-fold: (1) exit for a small profit of $0.20, or (2) stay with it but deploy options to significantly reduce the effective cost.
In the latter, weekly September 11th 106 calls bring $1.92. These are in-the-money calls, so it is possible they get called away. And that is the idea, given the price action in gold currently. If called away, it ensures a profit of $0.63. Fine, we will revisit the trade later. If not called away, GLD ($107.49) needs to drop 1.4 percent during the holiday-shortened week. Last week, it lost 1.1 percent. If GLD drops below $106, the effective cost drops to $105.37.
Thanks for reading!
