
Volatility has been the name of the game in stocks in the past month.
Between the August 18th intra-day high of $209.59 and the August 24th intra-day low of $181.46, SPY, the SPDR S&P 500 ETF, lost north of 13 percent. All in four sessions! Then from that low to the intra-day high last Thursday, it rallied in excess of 11 percent. All this in 17 sessions!
Amidst the vicious sell-off last month, bulls mustered courage and put their foot down. This is good. The bad? Shorts are not giving up. The former had – still do – a great opportunity to force a short squeeze, but the winds may be beginning to blow in favor of the latter – duration notwithstanding.
Here are three reasons why.
1. The selling last month accelerated once the ETF lost $203. This has been an important support/resistance line going back to November last year. When it was lost, nerves set in. Once things stabilize, it is not uncommon for the price to go test that level. This likely took place last week. Immediately after the FOMC decision on Thursday, stocks rallied strongly. SPY jumped 1.4 percent to as high as $201.84, but only to give it all back and then some. In the end, the session produced a shooting star – a bearish pattern – followed by another on Friday (Chart 1).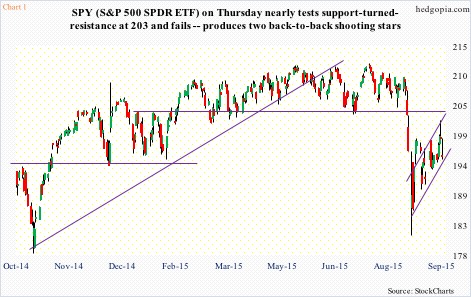
2. Shorts are staying put. As of August 30, short interest on SPY stood at 373.1 million, up a whopping 19.3 percent over the prior period (Chart 2). The August 14-31 period in which this spike occurred also had the ETF rally eight-plus percent from the August 24th low, raising the odds of a squeeze. Nonetheless, shorts did not turn tail and run.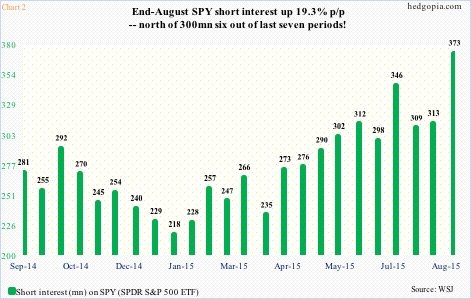
As a matter of fact, if we are to go by non-commercials’ holdings in S&P 500 futures, shorts are getting aggressive. As of last Tuesday, these traders were net short 258,900 contracts, up from 75,744 on August 25 (Chart 3). Stocks bottomed on the 24th, and net shorts have progressively gone up since.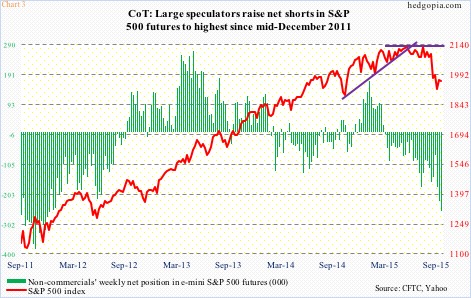
3. During the week ended September 16th, U.S.-based stock funds attracted $12.7 billion in inflows. This preceded outflows of -$16.2 billion in the September 9th week, -$865 million in the September 2nd, and -$17.8 billion in the August 26th. If these inflows were a result of recent stability in the markets, the latter should continue to behave, of which there is no guarantee.
This is where it can get tricky. The action on Thursday and Friday is a sign that there are still plenty of nervous souls out there. It is possible the sellers were waiting to see if the 203 resistance gets taken out, and as soon as they saw signs to the contrary they bailed. In other words, there is not much conviction in recent buying.
This is probably the reason why non-commercials have stayed net long VIX futures for the fourth straight week. Last week, they cut holdings by 12-plus percent, but last week’s reading was an all-time high (Chart 4). Historically, this has been a time to sell volatility. Indeed, spot VIX has tumbled from north of 53 on August 24 to north of 22 now. Here is the rub. VIX looks to be itching to move higher in the near-term – the same way SPY ($195.45) seems to want to go lower on a daily chart.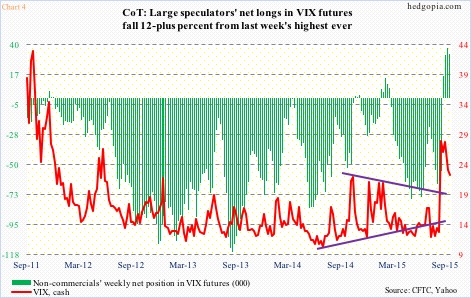
All this probably sets up well for income generation in options.
September 25th weekly SPY 197.5 calls fetch $1.30. Naked calls inherently are risky, but work in a neutral to mildly bearish scenario. Hypothetically, if called away, it is an effective short at $198.8 – near last Friday’s high ($198.68).
Thanks for reading!
Please keep in mind that this article was originally published earlier today by See It Market, where I am a contributor.
