
- Put-to-call ratios, VIX:VXV point to potential selling pressure in stocks
- But large specs expecting lower VIX not in agreement with peers betting on lower SPX
- Task of separating wheat from chaff – which signal to treat as signal and which one as noise – tough
Whipsaws and mixed signals! That has been the story of U.S. stocks for weeks now.
Since April, the S&P 500 large cap index has lost its 50-day moving average three times, recaptured it four times. The index has been range-bound for nearly three months now, with decent swings. Also since April, the VIX tried to take out 15 seven times, and came a cropper each time. Just last week, there were three one-percent intra-day moves in the S&P 500, before rising 0.4 percent for the week!
Talk about volatility!
The problem facing investors in such an environment is, should they trust signals that have a good track record or brush them off as mere whipsaws. Or, for that matter, which one to trust and which not to?
Here are some examples.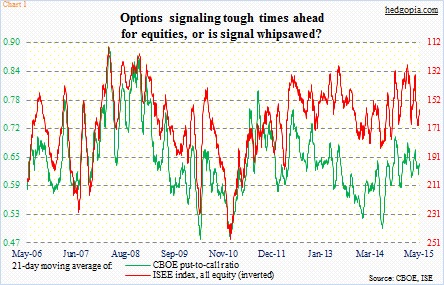
Take Chart 1. It plots the 21-day moving average of the CBOE put-to-call ratio and the ISEE index, all equity. The latter is a call-to-put ratio, hence inverted. Both have turned up, and that is supposed to bring bad news for stocks. Granted, the put-to-call ratio in particular did not drop enough before turning up. Nonetheless, once they start moving up, more often than not they continue on that path. Will they this time?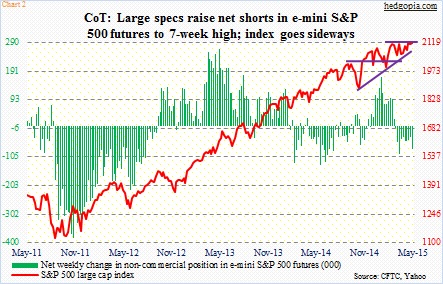
If Chart 1 lives up to its reputation, large speculators would have been right in their bearish stance on the S&P 500. In the latest reporting period, they raised net shorts in e-mini S&P 500 futures to a seven-week high (Chart 2). Their holdings are as of last Tuesday, a day when the index declined 1.2 percent. Since then, the index has turned around. So it is entirely possible these shorts got squeezed, particularly last Friday. We will find out this week.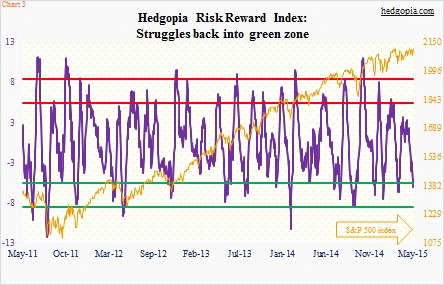
But assuming these traders have maintained their bearish bias and signals coming from the options market are borne out, then our own Hedgopia Risk Reward Index should continue lower. It has just entered the green zone, raising the odds that stocks rally. If it is a false signal, there is room for it to go lower (Chart 3).
This will of course not sit well with large speculators who are betting that the VIX continues lower. They just raised net shorts in VIX futures to an 11-month high (Chart 4). The fact that sellers have persistently appeared the past couple of months every time the index has tried to push through 15 plays to large specs’ advantage. On the other hand, the VIX has not broken 12 the past five months. Something has to give.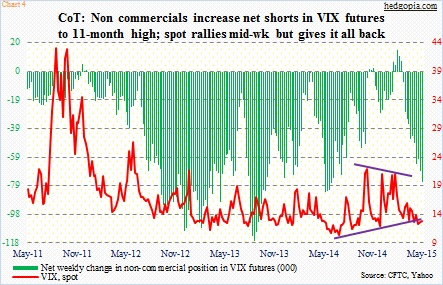
If in due course large specs are proven right on their VIX trade, then the VIX to VXV ratio in Chart 5 would have sent a whipsawed signal. The ratio is currently in oversold zone. Historically, as it moves up, stocks decline. The VIX measures 30-day volatility on S&P 500 options, while the VXV does the same but goes out three months. So when stocks come under pressure, there is more demand for near-term volatility, hence the rise in the ratio. Further drop in the ratio, on the other hand, would suggest a rise in near-term complacency. Twice since December, the ratio has dropped to 0.78. This time around, it is taking awfully long to bolt out of the oversold zone – has been stuck in the 0.70s-0.80s range for 14 weeks now. A sign of the times!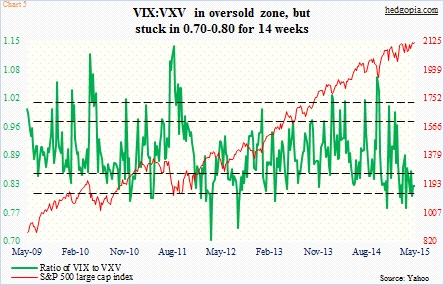
The hardest part is differentiating between signal and noise. Pay more attention to Charts 1, 2 and 5, or Charts 3 and 4? Or how about just wait until the S&P 500 breaks, one way or the other? That will be the signal. Provided the break is clean, that is.
