
Markets tend to be either risk-on or risk-off. For the most part, anyway. One of the ways market participants can keep a pulse on risk-taking – or a lack thereof – is by simply looking at which sectors are outperforming.
Not all sectors or industries are made from the same cloth – some sectors investors gravitate toward when they are in a mood to take on risk, and some they shy away from when they are not.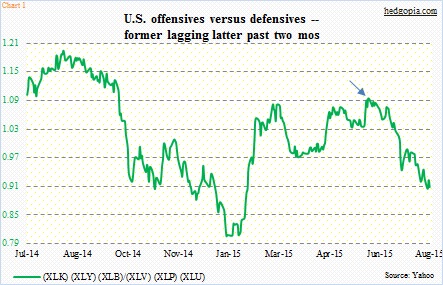
Chart 1 takes a ratio of offensive to defensive sectors. In the offensive category, XLK (technology), XLY (consumer discretionary) and XLB (materials) are included, while defensives are comprised of XLV (health care), XLP (consumer staples) and XLU (utilities). These are all SPDR ETFs.
Most recently, the ratio between the two peaked on June 5 at 1.09 (arrow in Chart 1), before coming under sustained pressure the next couple of months. During the period, the S&P 500 Index essentially went sideways.
However, you would not know this – defensives performing better than offensives – looking at XLY versus XLP.
First off, XLY’s top five holdings include AMZN (8.4 percent), DIS (7.9 percent), CMCSA (6.5 percent), HD (6.3 percent) and MCD (3.9 percent). For XLP, they are PG (11.4 percent), KO (9.1 percent), PM (7.3 percent), CVS (7.0 percent) and WMT (6.3 percent).
DIS shares reacted poorly yesterday to the June-quarter results – down a whopping nine percent. So that had an impact on XLY. Even after this, the ETF still sits comfortably above the breakout point a month ago (Chart 2).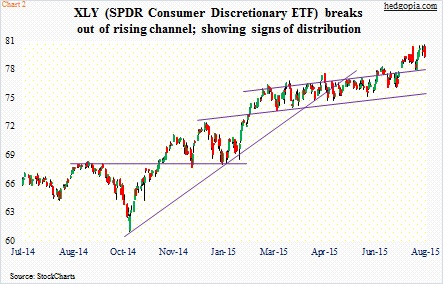
Early July, XLY broke out of a slightly rising channel, followed by a successful retest. The breakout took place around the time XLP staged its own breakout. The latter also had a successful retest, and a subsequent mini breakout to boot (arrow in Chart 3).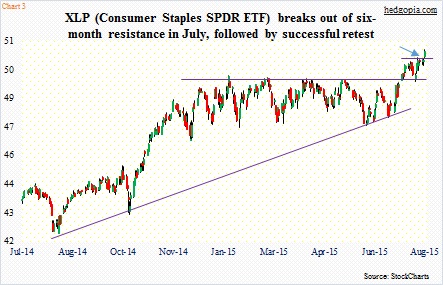
But the question is, why are they both acting strong?
If the U.S. economy is picking up steam – not a base case on this blog – then it would make sense for money to flow into XLY. If it is muddling along at best and getting worse at worst, then XLP should be attracting money. At least that is what the conventional wisdom tells us.
But here we have both acting strong, with breakouts to boot. For reference, the S&P 500 peaked 10 weeks ago.
Does it suggest that the consumer is too strong even though the economy is not? That is not the message coming out of retail sales anyway.
Year-over-year, growth in retail sales has been decelerating since last August (Chart 4). Sales grew at five percent back then, and by June had decelerated to 1.4 percent. In the first half this year, month-over-month, sales grew in three months and fell in the other three. June dropped 0.3 percent to $442 billion from May’s high of $443.2 billion. When June was reported, the prior three months were all revised lower.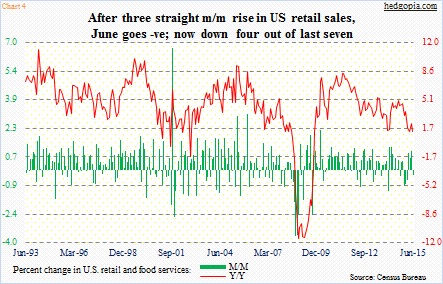
Here are two observations on this.
One, it is possible investors are playing both sectors as a way to hedge one with the other. The economy acts tentative, but expectations are high for the second half as well as next year. What if these forecasts are right? That argues for overweighting XLY. On the other hand, market multiples are no longer cheap. Depending on what metric one looks at, it is anywhere from fairly valued to expensive. In the meantime, earnings are decelerating, which, if persists, may not bode well for stocks in general in the coming months. In this scenario, XLP makes sense.
Secondly, consumer staples may already be leading its discretionary counterpart in a stealth manner.
Back when stocks bottomed in the middle of October last year, a trend line is drawn from that low in Chart 2. This was an important bottom. But XLY lost that trend line late April. XLP, on the other hand, made a higher low mid-October. The trend line in Chart 3 is drawn from a low in August that year, and has not been lost. Buyers have been willing to defend the XLP trend line more than on XLY.
Yesterday, the two clearly diverged from each other. Once again, DIS was the driver behind XLY’s 1.1-percent drop yesterday. XLP ($50.82) rallied 0.9 percent. The divergence likely continues.
In the days ahead, XLY ($79.42) is probably headed toward once again testing that breakout point – around $78, which also approximates the 50-day moving average. In the past several sessions, there have been signs of distribution.
Thanks for reading!
