- U.S. stocks quickly shake off China- and Greece-induced worries
- Can bulls use the reversal as opportunity to mount a breakout on Russell 2000?
- Several technical indicators have room to move higher still before they get overbought
Whoa! Some reversal that was by U.S. equities yesterday. The China- and Greece-induced selloff was embraced with open arms. Lows were in in the very first hour, including the S&P 500 Large Cap Index. Several others such as the Nasdaq Composite bottomed in the first five or 10 minutes; and this includes AAPL, XLE, the energy ETF, and SMH, the semiconductor ETF. Buyers’ intentions were clear. They wanted to buy the weakness. While volume was nothing to write home about, it is December after all. The heck with global woes! Those that have had a good 2014 have probably cut back exposure. Those that are still underperforming are chasing it. For at least the rest of the month, today’s lows will now have special significance.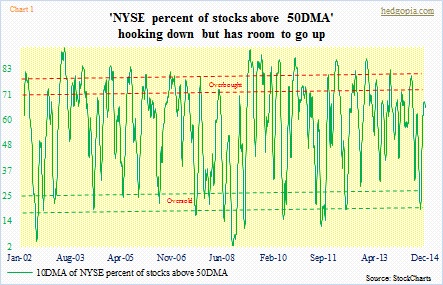
That will be particularly true for small-caps. For nearly three weeks now, buyers have shown up to defend the 200-day moving average on the Russell 2000 Small Cap Index. And that is where the bottom of the range it is in lies. The top of that range is essentially where it closed yesterday (1188). Yesterday, it was pointed out how for four consecutive weeks prior to last week the Russell 2000 had produced dojis. With today’s action, there are now two bullish hammers – last week and so far this week. Bulls should love this. This is as good an opportunity as they will probably get to try to stage a range breakout here and then go attack the ultimate resistance, which is just north of 1,200. If a breakout occurs, that will be impressive, as the index has been going sideways all year now.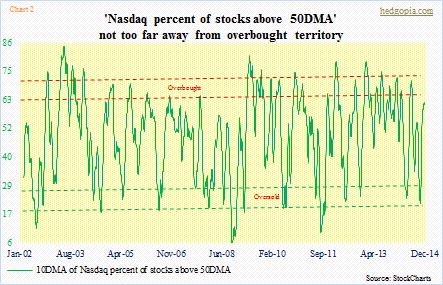
You ask, underneath all that, how were the internals? Well, let us just say, they could have been better. As did the S&P 500, the NYSE Composite was essentially unchanged for the day. But there were 248 new lows and 108 new highs. How about the Nasdaq? From the lows of the day, the tech-heavy index closed two percent higher. That is how powerful the reversal was. Nonetheless, there were 92 new highs and 171 new lows. Yes, more lows than highs. So it is really tough to make head or tail of how the session progressed and the reversal per se. People seem to want to play the seasonally favorable December phenomenon but at the same time do so by hiding in the “safer” names.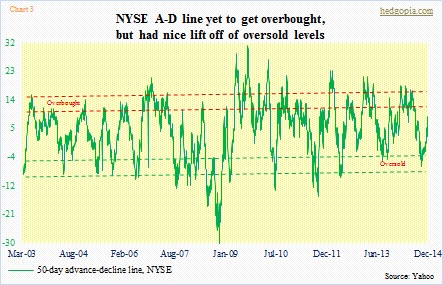
On both the NYSE (Chart 1) and the Nasdaq (Chart 2), the ‘percent of stocks above 50-day moving average’ is struggling to get to low-to-mid-80s and mid-to-high-70s, respectively. In the charts, a 10-day moving average has been calculated for smoothing purposes. Since the October 15th bottom, both have unwound a substantial portion of the oversold conditions they were in, but there is still room to go higher before they get overbought.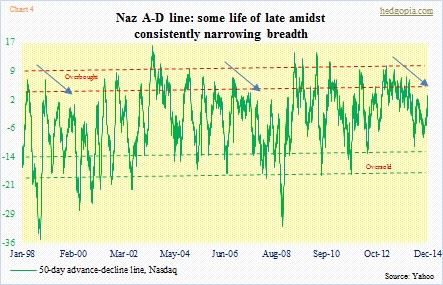
That is also the case with the NYSE A-D line (Chart 3). There is room for it to move up before it gets overbought. And lo and behold! Even the otherwise lagging Nasdaq is making a nice move (Chart 4). The three arrows point to consistently deteriorating breadth – one leading up to 2000/2001, another leading up to 2007/2008 and the third one in progress now.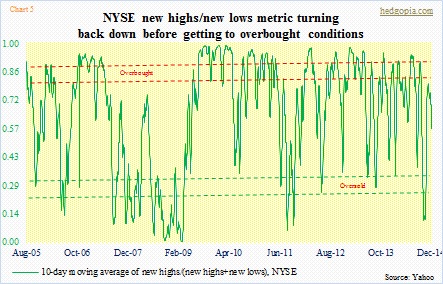
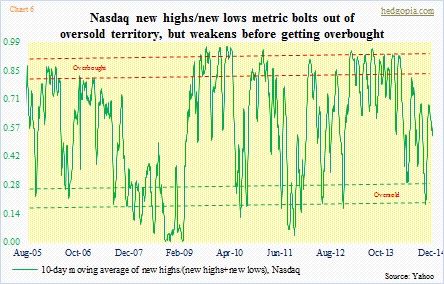
Not to labor the point, but one consistent theme in the ongoing seven-week rally has been poor breadth signified by new highs and lows. On both the NYSE (Chart 5) and the Nasdaq (Chart 6), it is already turning lower. On both indices, this metric is currently halfway through the range. So if the reversal in stocks yesterday has a staying power, both of these metrics better move back up. That will be a telltale. No bias, but fingers crossed.