The following are futures positions of non-commercials as of April 26, 2016. Change is week-over-week.
10-year note: Two different central-bank meetings, and two different market reactions this week.
Haruhiko Kuroda, Bank of Japan governor, has a habit of surprising the markets, not disappointing them. On Thursday, he did the latter. Market participants were expecting a heavy dose of stimulus. Mr. Kuroda did not pull out his big bazooka this time. The bank maintained its negative 0.1 percent deposit rate and ¥80-trillion base money target. This, despite the fact that it lowered its 2016-2017 fiscal year GDP forecast from 1.5 percent to 1.2 percent. The yen reacted by jumping 2.4 percent; the Nikkei closed 3.6 percent lower.
Across the Pacific, here at home, as expected, the Fed this Wednesday left interest rates unchanged. Recall that ahead of the meeting it forecast two rate hikes this year, down from forecasts late last year of four.
Be that as it may, the Fed will have a good excuse not to move in the June 14-15 meeting, which is the June 23rd U.K. European membership referendum on whether to remain in the European Union.
This is a Fed that, besides its dual mandate of maximum employment and price stability, seems to have added a third one – global markets.
Wednesday’s FOMC statement expressed less concern about global risks than it did during the March meeting. But it will continue to “closely monitor” global markets. Potential uncertainty over ‘Brexit’ probably takes June off the table.
Currently net short 63.8k, up 39.5k.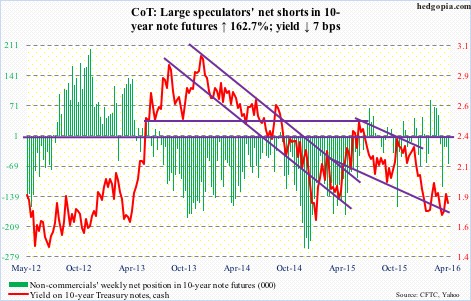
30-year bond: Major economic releases next week are as follows.
April’s ISM manufacturing index comes out on Monday. March was 51.8 – first 50-plus reading in six months. New orders spiked 6.8 points month-over-month to 58.3; prior to this, three of the last six months was sub-50. Will be interesting to see if orders maintain March’s momentum.
Wednesday brings productivity (preliminary 1Q16), factory orders (March revised), and ISM non-manufacturing (April).
Non-farm business output per hour decreased at a 2.2-percent annual rate in 4Q15. Year-over-year, productivity increased 0.5 percent. That’s it – a mere 0.5 percent! Productivity remains highly suppressed – one of the hallmarks of the current recovery.
The advance report on durable goods for March was reported last week. More detailed estimates, plus non-durable goods, will be reported on Wednesday. Year-over-year, new orders for non-defense capital goods ex-aircraft – proxy for business capital expenditures – contracted 2.4 percent in March to a seasonally adjusted annual rate of $66.9 billion. This was the 14th consecutive y/y decrease in orders. Orders peaked at $74 billion in September 2014.
The ISM non-manufacturing index rose 1.1 points in March to 54.5 – first m/m increase in five months. New orders rose 1.2 points m/m to 56.7. Orders were 62.6 last July.
April’s employment report is published on Friday. Non-farm payroll in March increased 215,000, for a monthly average this year of 209,000 – decent but not going gangbusters. This is reflected in private-sector average hourly earnings, which are stuck in y/y growth of two-plus percent. The last time earnings grew with a three handle was in April 2009.
Four FOMC members are scheduled to speak during weekdays.
Currently net long 48.2k, down 4.8k.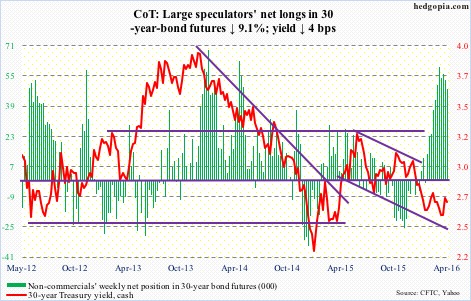
Crude oil: There goes $43.50 on spot West Texas Intermediate crude. This resistance goes back to January last year, and, in fact, can be extended to even July 2004.
Technically, crude momentum is intact. That said, Friday, a high-volume session, produced a long-legged doji – first sign of distribution in a while.
This week, help came from the U.S. dollar.
Fundamentally, data were mixed at best.
For the week ended April 22nd, crude inventory rose by another two million barrels to 540.6 million barrels. In the past 16 weeks, stocks have gone up by 58.3 million barrels, and are inching ever closer to the all-time high 545 million barrels in 1929.
Also not helping matters were gasoline stocks, which increased 1.6 million barrels to 241.3 million barrels. And refinery utilization fell 1.3 percentage points to 88.1 percent. Utilization has dropped by 3.3 percentage points in the past three weeks.
On the positive column, distillate stocks fell 1.7 million barrels to 158.2 million barrels. Crude imports fell 637,000 barrels per day to 7.6 million b/d.
Last but not the least, crude production dropped 15,000 b/d to 8.9 mb/d. This was the third straight week of sub-nine mb/d. Production peaked at 9.61 mb/d in the June 5th week last year, so has declined by more than 600,000 b/d.
Spot WTI (45.99) began its freefall in June 2014, dropping from 107.68 to the February 11th hammer low of 26.05. A 23.6-percent retracement of the decline puts the crude at 45.31.
Currently net long 329.8k, up 3.5k.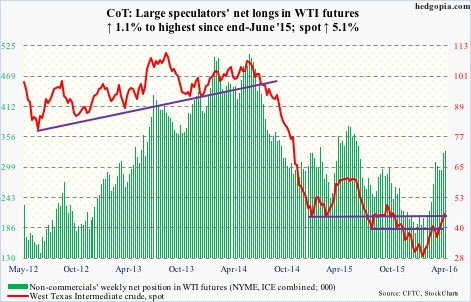
E-mini S&P 500: This week’s, as well as last week’s, high on the S&P 500 index tagged the slightly declining trend line from the May 2015 all-time high. The April 20th high (2111.05) was a mere 1.1 percent from 2134.72, the May 2015 high.
If stocks come under renewed selling pressure, and the May 2015 high is not breached, technically speaking a bear market could still have begun in that month.
That aside, bulls are probably disappointed that they were not able to build on last week’s golden cross.
This, despite the fact that in the week ended Wednesday SPY, the SPDR S&P 500 ETF, attracted $3.2 billion, after outflows of $2.9 billion in the prior week (courtesy of ETF.com).
As well, following outflows of $9.3 billion in the prior two weeks, U.S.-based equity funds attracted $101 million in the week ended Wednesday. Since the week ended February 10th, however, $16.5 billion has been withdrawn.
Not what one would want to see when momentum is in deceleration. Shorter-term moving averages are rolling over. Prior to Thursday’s 0.9-percent decline, this is how the S&P 500 traded in the prior six sessions – spinning top/doji, spinning top/doji, hanging man, hanging man, filled candle, and doji.
In the meantime, non-commercials no longer hold net shorts, which in previous weeks were a big tailwind for stocks as positions were reversed.
Currently net long 1.5k, up 67.4k.
Euro: Eurozone bank lending grew 1.1 percent y/y in March, slightly faster than February’s one-percent growth. Recall that on March 10th the ECB said it would offer new loans to banks designed to boost lending, but that would not be forthcoming until June.
As well, Eurozone GDP expanded by 0.6 percent in 1Q16 – the fastest pace in a year, and up from 0.3 percent in 4Q15. Last but not the least, consumer price inflation fell by 0.2 percent in April, following a flat March.
For the week, the euro rallied two percent, and has room to move higher still on a daily chart. Resistance at 114-114.50, which goes back to January last year, provides the biggest hurdle. The currency closed the week right on that resistance.
Currently net short 39.7k, down 7.3k.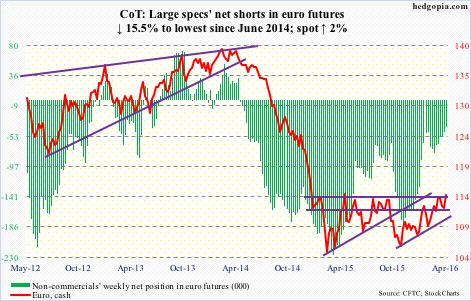
Gold: Since February 11th when the metal spiked 4.1 percent (and stocks bottomed), spot gold has hung in there, essentially going sideways.
Since April 1st, buyers have continued to show up at/near the 50-day moving average. This was once again the case this Thursday, when the metal rallied 1.7 percent, followed by another 2.1-percent move on Friday, breaking out of the range. The dollar helped.
Flows into GLD, the SPDR gold ETF, are not helping matters, though, as $94.3 million were redeemed in the week ended Wednesday, coming on the heels of $206.8 million in outflows in the prior week (courtesy of ETF.com).
Spot gold rallied five percent in the week – sort of vindication for non-commercials who of late have been aggressively adding to net longs.
Currently net long 220.9k, up 4k.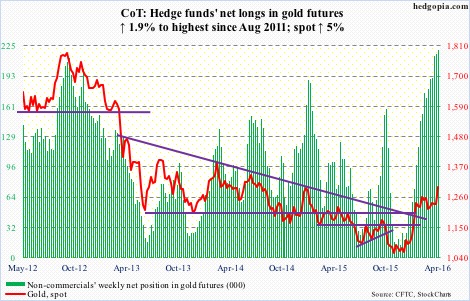
Nasdaq 100 index (mini): Last week, disappointing earnings from Alphabet (GOOGL) and Microsoft (MSFT), among others, led the Nasdaq 100 to lose 1.5 percent, underperforming its peers – versus the S&P 500 which was up 0.5 percent, the Dow Industrials up 0.6 percent, and the Russell 2000 small cap index up 1.4 percent.
This week, the streak of disappointing tech earnings continued, with Apple (AAPL) sorely missing estimates, although Facebook’s (FB) was perceived well.
As is the case with the S&P 500, there were tons of exhaustion signs on the Nasdaq 100 prior to the breakdown this week. It lost both its 50- and 200-day moving averages, and is literally sitting on support at 4350, which goes back to November 2014.
In the week ended Wednesday last week, $643.1 million came out of QQQ, the PowerShares Nasdaq 1000 ETF. This week, there were inflows, but merely $96.6 million. Not enough to stop the index from losing another three percent.
Currently net long 36.8k, down 13.7k.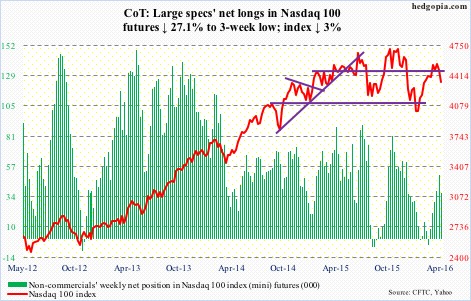
Russell 2000 mini-index: Off February 11th lows through recent highs, the Russell 2000 outperformed its peers – up 22.6 percent, versus the S&P 500 (up 16.6 percent), the Nasdaq 100 (up 17.6 percent), and the Dow Industrials (up 17.2 percent), among others.
Flows have cooperated. From February 11th through this Wednesday, IWM, the iShares Russell 2000 ETF, attracted $1.2 billion (courtesy of ETF.com).
Investor preference for risk-on, seen through willingness to get on the small-cap bandwagon, however, is not evident elsewhere. Margin debt, for example.
In March, NYSE margin debt rose a mere $10 billion, to $445.8 billion. This was a month in which the S&P 500 rallied a strong 6.6 percent, but traders were not willing to aggressively take on debt. From the April 2015 high of $507.2 billion, margin debt has declined by $61.3 billion.
Currently net short 55.5k, down 1.4k.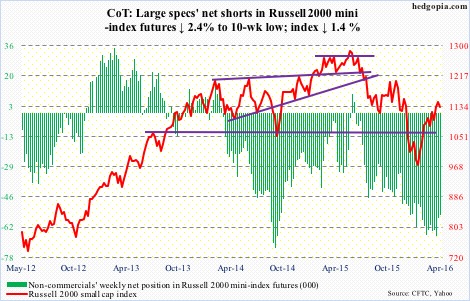
US Dollar Index: Blame the Bank of Japan for Thursday’s 0.7-percent slide in the US dollar index. The bank shocked markets by voting against more stimulus. The yen surged 2.4 percent, while the Nikkei collapsed 3.6 percent.
With this, the dollar index (93.03) has lost support at 93.50, which goes back to January last year.
Non-commercials continue not to show any interest in adding to net longs, which are at a 10-month low.
Currently net long 11.3k, down 2.1k.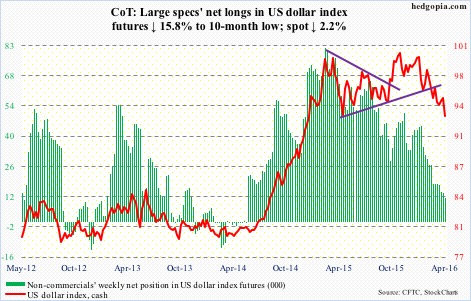
VIX: Spot VIX has essentially gone sideways for six weeks now, and needs to get over 16 to break out of range.
The time is perfect for that to happen, with both 10- and 20-day moving averages slightly pointing up. The weekly chart has tons of oversold conditions remaining to be unwound. Friday, it jumped to 17.09 intra-day before pulling back to close at 15.70, just under its 50-day moving average.
Similarly, in four of the six weeks leading up to this week, the VIX-to-VXV ratio came in at sub-0.80, with the March 14th week producing a reading of 0.782 – a one-year low. The other two weeks were in the low 0.80s. This week, the ratio jumped to 0.85. If history is guide, it is not done moving up, and that means higher VIX.
Currently net short 75.9k, up 16.5k.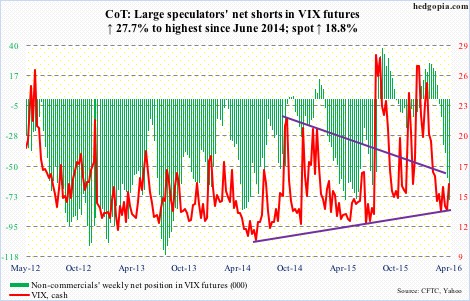
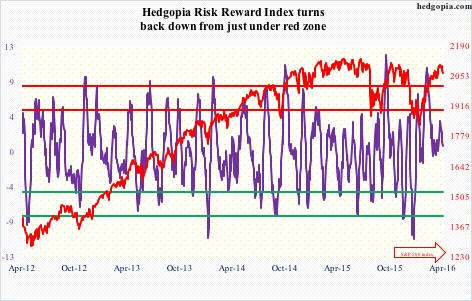
Hedgopia Risk Reward Index