The following are futures positions of non-commercials as of May 31, 2016. Change is week-over-week.
10-year note: On June 14-15, the FOMC meets. This is the year’s fourth meeting, and there will be four more left after this (July 26-27, September 20-21, November 1-2, and December 13-14).
Prior to Friday’s dismal 38,000 non-farm-payroll print for May, the June 14-15 meeting was all set to be a well-fought duel between FOMC hawks and doves. In the past few weeks, the former have been vocal, with several regional Fed presidents, some voting some non-voting, strongly voicing the need for higher rates.
And then there are doves like Daniel Tarullo, Fed governor, who are as steadfast. On Thursday, he indicated he was in no hurry to raise interest rates, looking for “an affirmative reason to move.” On Friday, post-employment report, Lael Brainard, another governor, suggested the Fed wait for more data before raising rates.
Enter Janet Yellen, Fed chair, a dove until recently, but in a May 20th interview at Harvard University, did say an interest rate hike would probably be “appropriate” in the coming months. When she made those comments, May’s employment numbers were not out. Now they are.
Next week on Monday, she has two speeches scheduled – at 12:30PM and 2PM – giving her ample opportunity to drop a wink and a nod as to which way she is leaning.
With the May jobs report, June is now out of the question. Plus, the U.K. vote on EU membership is on the 23rd.
By the time July rolls around, FOMC members would have seen June’s payroll, and even if we assume the report is decent, the July meeting does not have a press conference scheduled. The two others with press conference are September and December. For whatever it is worth, the November meeting is right in front of the November 8th U.S. presidential election.
The window to move this year is getting narrower.
Currently net short 141k, up 60.7k.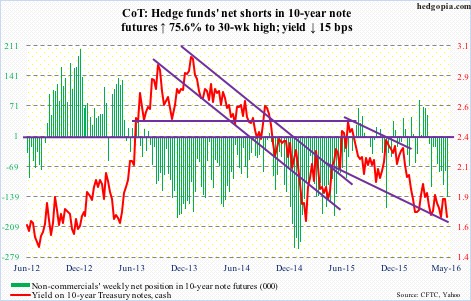
30-year bond: Major economic releases next week are as follows. It is relatively light.
Revised productivity numbers for 1Q16 come out on Tuesday. The preliminary estimate showed non-farm output per hour decreased at a one-percent annual rate. Year-over-year, productivity increased 0.6 percent.
Also on Tuesday is published consumer credit for April. March was $3.59 trillion (seasonally adjusted), up 0.8 percent month-over-month and up 6.6 percent year-over-year. Most notably, student loans now stand at $1.35 trillion and auto loans at $1.05 trillion (both not seasonally adjusted) – up respectively from $710.9 billion and $742 billion in June 2009.
Wednesday brings JOLTS for April. Job openings increased 149,000 in March to 5.76 million. In November last year, they had dropped to as low as 5.2 million. That said, openings have essentially gone sideways since last July’s 5.79 million.
The University of Michigan’s consumer sentiment for June (preliminary) is published on Friday. It jumped 5.7 points in May to 94.7 – the highest since last June. Sentiment peaked at 98.1 in January 2015 – an 11-year high.
Currently net long 64.3k, down 8k.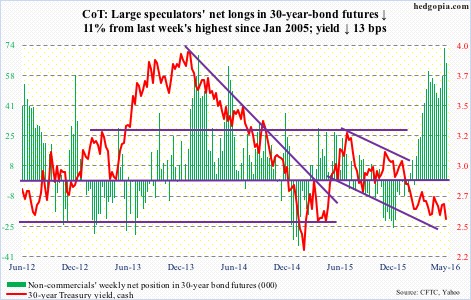
Crude oil: There you go!
After all the pre-meeting talk/rumors of an impending deal, OPEC on Thursday failed to agree on a new production ceiling.
With no deal, and crude oil having rallied big into the meeting – nearly 93 percent between the February 11th low and the May 26th high – the odds of a pullback have grown. The question is of magnitude and duration.
Needless to say, spot West Texas Intermediate crude remains overbought. There is plenty of unwinding left on a weekly chart. That said, daily momentum is yet to break, with the 10-day moving average flattish and the 20-day still pointing up.
The path of least resistance remains down.
On Thursday, post-OPEC disappointment, crude was under pressure, but the weakness was bought, reacting to the U.S. weekly data.
For the week ended May 27th, inventory was down across the board.
Crude stockpile dropped by another 1.4 million barrels to 535.7 million barrels. Inventory is now down 7.7 million barrels from the April 29th high of 543.4 million barrels, which was the highest since the all-time high 545.2 million barrels in October 1929.
Gasoline stocks fell by 1.5 million barrels to 238.6 million barrels. Inventory is now down by 20 million barrels from the February 12th high of 258.7 million barrels.
Along the same lines, distillate inventory fell by 1.3 million barrels to 149.6 million barrels – now down 15.9 million barrels from the January 8th high of 165.6 million barrels.
Crude production, too, fell, by another 32,000 barrels per day to 8.74 million b/d. This was the 12th straight weekly drop and eighth sub-nine mb/d. Production peaked at 9.61 mb/d in the June 5th week last year.
Refinery utilization rose one-tenth of a point to 89.8 percent.
On the negative side, crude imports increased by 524,000 b/d to 7.84 mb/d – a six-week high.
Currently net long 363.3k, down 1.8k.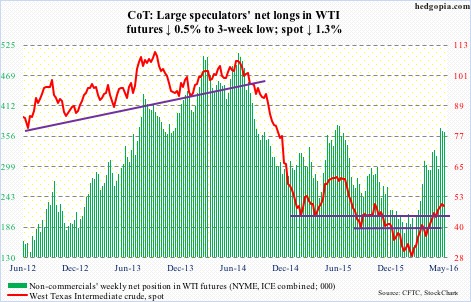
E-mini S&P 500: The ‘sell in May, and go away’ adage did not pan out this year. The S&P 500 gained 1.5 percent in the month. On April 20th (intra-day high), it was merely 1.1 percent from the all-time high 2134.72 in May last year. Thus completes one whole year without a new high.
It will be a major win for the bulls if the S&P 500 somehow manages to decisively break out of this one-year consolidation. ‘Decisively’ is the key word here. And for that to happen, new sources of buying need to emerge. So far, corporate buybacks have been the only reliable source.
Foreigners have been net sellers of U.S. equities for a while now. NYSE margin debt is way off the $507.2-billion peak in April last year, with April this year at $455.6 billion. And flows continue to disappoint.
In the week ended Wednesday, $776 million came out of U.S.-based equity funds. Since the week to February 10th, north of $43 billion has been redeemed (courtesy of Lipper).
In the same week, SPY, the SPDR S&P 500 ETF, attracted $384.5 million, but lost $2.6 billion in the last three sessions (courtesy of ETF.com).
With daily conditions overbought, selling pressure is starting to emerge. The good thing is, bulls were able to defend the 2085 region for six straight sessions, including on Friday. However, the daily chart now has three consecutive hanging man candles – potentially bearish.
Currently net long 44.4k, down 39k.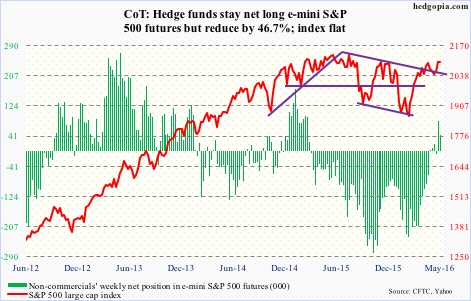
Euro: Eurozone consumer prices fell 0.1 percent in May y/y, following a drop of 0.2 percent in April. This was a fourth straight monthly drop. The ECB targets inflation of just under two percent.
In the meantime, Eurozone loans to non-financial companies rose 1.2 percent in April, versus 1.1-percent rise in March. Household lending slowed to 1.5-percent growth, versus 1.6 percent in the prior month. The M3 money supply grew by 4.6 percent, slower than five percent in March.
Either way you cut it, the effects of the ongoing monetary stimulus are yet to show up in the Eurozone data.
The ECB nonetheless is optimistic for the rest of the year, upgrading this year’s growth and inflation forecasts. The former goes to 1.6 percent from 1.4-percent forecast in March, and the latter from 0.1 percent to 0.2 percent.
The euro rallied 2.3 percent for the week, not because of ECB optimism but due primarily to Friday’s dismal payroll data in the U.S. The euro surged 1.9 percent in the session. The daily oversold conditions it was in helped.
One-plus-year resistance at 114-114.50 probably gets tested again.
Currently net short 37.7k, down 241.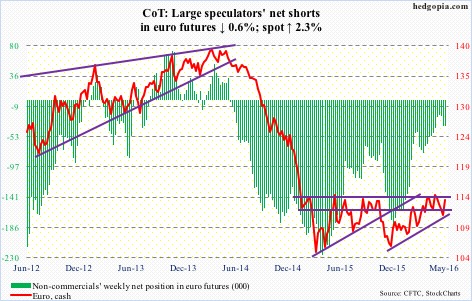
Gold: Spot gold produced a hammer session on Tuesday, with buyers showing up on crucial support. The metal has essentially been sideways the past four months, and was in the process of testing the lower bound of the range.
Daily technicals were grossly oversold, with the price hugging the 100-day moving average in the four sessions leading up to Friday. Post-jobs report, the yield curve shifted lower, with short-term rates in particular taking it on the chin.
Spot gold took off, up 2.5 percent on Friday, with plenty of room to continue to rally.
Non-commercials cut back a little. But this was prior to Friday’s move. Next week’s will reflect their true intention. Net longs were the highest four weeks ago, and have come down since.
Currently net long 197.1k, down 9.5k.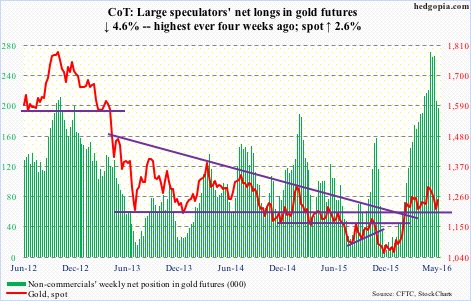
Nasdaq 100 index (mini): If Apple (AAPL) wants to go lower, with a 10.5-percent weight in the Nasdaq 100, that has to have an impact on how the index performs. Potentially. And AAPL for now does seem to want to go lower. Last week, it just about tested its declining 50-day moving average, before coming under pressure.
The index, on the other hand, is past both its 50- and 200-day moving averages, trading along its upper Bollinger Band the past several sessions. The daily chart is looking way extended, with flows cooperating so far.
In the week ended Wednesday, QQQ, the PowerShares Nasdaq 100 ETF, attracted $369 million. This followed inflows of $318 million in the prior week (courtesy of ETF.com).
Currently net long 55k, up 24.8k.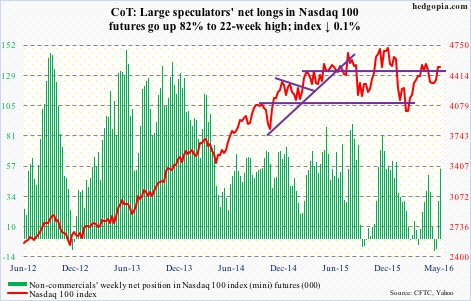
Russell 2000 mini-index: In the week ended Wednesday last week, IWM, the iShares Russell 2000 ETF, attracted $1.4 billion. This week, another $448 million moved into the ETF (courtesy of ETF.com). This shows up in how the Russell 2000 is performing.
The index rallied another 1.2 percent in the holiday-shortened week, outperforming its peers. It is now less than four percent from two-plus-year resistance at 1200-plus.
That said, since the February low, the Russell 2000 has only managed to rally along underneath a broken trend line drawn from March 2009, not break out of it.
Thus far, non-commercials, who have been severely squeezed, are doing their bit. Net longs have come down from nearly 67,000 contracts seven weeks ago to 31,000 now.
Currently net short 31k, down 6.1k.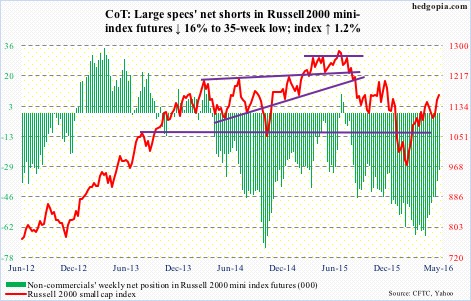
US Dollar Index: Has been range-bound between 100-plus and 93-ish for over a year now. In the middle, 96 has proven to be an important price point as well. This Wednesday, the dollar index rose to 95.91 before retreating.
Then came Friday, and the disappointing jobs report; the dollar index collapsed 1.6 percent. Prior to this, weekly indicators were approaching/at the median. This was a good opportunity for dollar bears to try to push the index lower, and they have.
Thus far, they have non-commercials on their side. The latter, having pushed net longs to two-year lows four weeks ago, continues to act tentative.
A week ago Friday, Ms. Yellen delivered the afore-mentioned comments at Harvard. Rather revealingly, these rather hawkish-leaning comments were not enough to convince non-commercials to start addding to net longs.
Currently net long 9.9k, down 1.3k.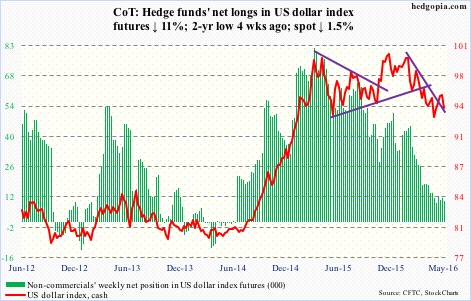
VIX: The 50-day moving average is flattish, and trying but struggling to rise. Throughout this week, spot VIX tried to rally past the average, but was denied.
The range-bound action continues. Ditto with the VIX-to-VXV ratio, which has been languishing in oversold zone – high-0.70s to low-0.80s – for 12 weeks now. The longer this goes on, the higher the odds of a sustained rally – eventually.
Currently net short 90.3k, up 5k.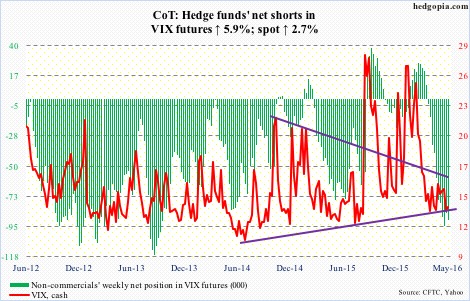
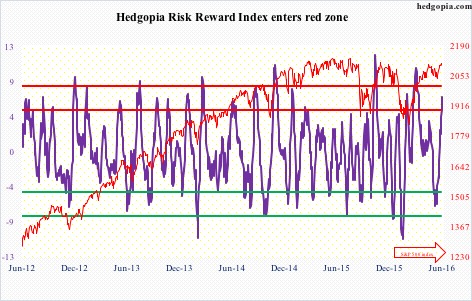
Hedgopia Risk Reward Index