The following are futures positions of non-commercials as of August 9, 2016. Change is week-over-week.
10-year note: Are we beginning to see a chink in central bankers’ armor?
Major central banks responded to the financial crisis by aggressively deploying both conventional and unconventional measures. They drew praise for that, as the crisis could have spiraled into something even more grave. They are now beginning to draw some flak – at least in some quarters – for overstaying their welcome. They continue to tinker with and seem to want to do away with business cycle.
Nearly a decade has passed since the crisis, and its root cause – leverage and debt – has only gotten worse. Central bankers in the meantime are dropping hints they are reaching the end of their rope.
The Reserve Bank of New Zealand on Thursday cut its benchmark interest rate by 25 basis points to a record low two percent. Governor Graeme Wheeler hinted at further easing. The New Zealand dollar rallied, however. Inflation is running at 0.4 percent in that nation, versus the bank’s mandate of one to three percent. Mr. Wheeler alluded that some central banks have run out of ammo.
Also this week, the Bank of England struggled to find enough bonds to buy. Pension funds and insurance companies are not parting with their gilts.
On January 29th this year, the Bank of Japan adopted negative interest rates for the first time ever. The yen bottomed that day and has rallied 20 percent since. Not something Governor Haruhiko Kuroda would have liked to see. For that matter, this is something no central banker would want to experience – markets not at their beck and call.
Currently net long 118.2k, down 3k.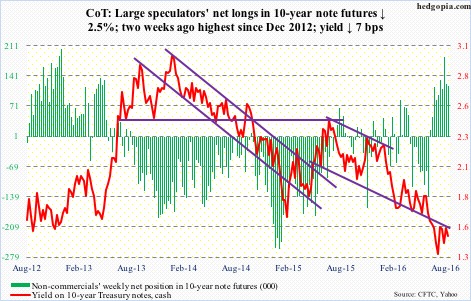
30-year bond: Major economic releases next week are as follows.
Monday brings the NAHB/Wells Fargo housing market index (August) and the Treasury International Capital data (June).
Builder sentiment dropped a point month-over-month in July to 59. From February to May this year, it was stuck at 58. The cycle high of 65 was reached in October last year – a 10-year high.
Recently, foreigners have been shunning both U.S. equities and Treasury securities. In May, on a 12-month running total basis, foreign purchases of equities were minus $134.1 billion and of Treasury bonds and notes minus $136.8 billion.
On Tuesday, CPI (July), housing starts (July), and industrial production (July) are published.
Consumer prices rose 0.2 percent in June and one percent in the 12 months through June. Core CPI also rose 0.2 percent and 2.3 percent year-over-year. This was the eighth straight month core CPI rose north of two percent annually.
Housing starts rose 4.8 percent m/m in June to a seasonally adjusted annual rate of 1.19 million units. The cycle high of 1.21 million was reached in June last year, which was matched in February this year. This was the highest since October 2007.
Capacity utilization increased 0.6 percent in June to 75.4 percent, but has been under pressure pretty much since it peaked at 78.9 percent in November 2014. Utilization has dropped for 16 consecutive months y/y.
FOMC minutes for the July 26-27 meeting are published on Wednesday.
Three FOMC members are scheduled to speak during weekdays.
Currently net long 58.5k, down 12.4k.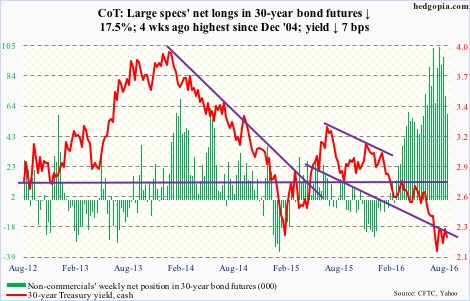
Crude oil: Saudi Arabia pumped a record 10.7 million barrels per day in July, and Iran has pushed up production to 3.9 mb/d. In July, OPEC’s crude production rose by 46,000 b/d m/m to 33.1 mb/d. OPEC, along with Russia, is seeing an increase in production. Mexico and the U.S. are going the other way.
In the week ended last Friday, U.S. crude production dropped by another 15,000 b/d to 8.4 mb/d – a five-week low. Production is down meaningfully since peaking at 9.61 mb/d in the June 5th week last year.
Stocks of both gasoline and distillates dropped – the former by 2.8 million barrels to 235.4 million barrels and the latter by two million barrels to 151.2 million barrels. Gasoline stocks have been drawn down by 23.3 million barrels since February 12th this year.
Crude imports dropped, too, by 334,000 b/d to 8.4 mb/d, but the prior week was the highest since October 19, 2012.
Refinery utilization fell by 1.1 percentage points to 92.2 percent – a seven-week low.
Crude stocks jumped 1.1 million barrels to 523.6 million barrels. Inventory is now up 4.1 million barrels in the past three weeks – although down 19.8 million barrels from the April 29th high of 543.4 million barrels, which was the highest since the all-time high 545.2 million barrels in October 1929.
Last week produced a hammer candle on spot West Texas Intermediate crude. This week, it struggled to build on it … until Saudi oil minister’s Thursday remarks about possible action to stabilize prices in OPEC’s informal meeting in late September. The jawboning worked. Spot WTI rallied six percent in that session, breaking out of $42.50-$43.50 resistance, and rallied another 2.3 percent on Friday. Will it stick?
Currently net long 266.9k, down 8.4k.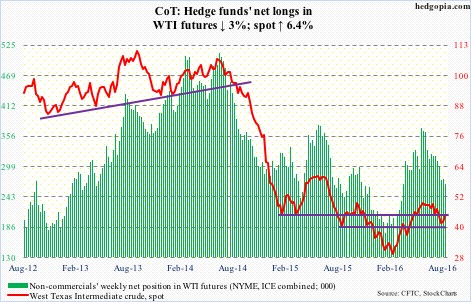
E-mini S&P 500: Yet another high – 2188.45 is the new number to beat! And a weekly doji following back-to-back weekly hanging man candles.
Since the breakout four weeks ago, the index has continued to grind higher, but momentum is decelerating. The 10- and 20-day moving averages were on the verge of a bearish crossover last week, but was denied by Friday’s post-jobs rally. Both averages are still sideways. A crossover is still possible.
In the week ended Wednesday, another $3.8 billion left U.S.-based equity funds (courtesy of Lipper. Since the June 29th week, nearly $15 billion has been withdrawn (stocks bottomed on the 27th).
That said, in the same week, SPY, the SPDR S&P 500 ETF, attracted $1.6 billion, more than offsetting the $897 million lost in the prior week (courtesy of ETF.com). Nevertheless, the S&P 500 pretty much ended flat for the week – up 0.05 percent.
Currently net long 100.7k, down 10.6k.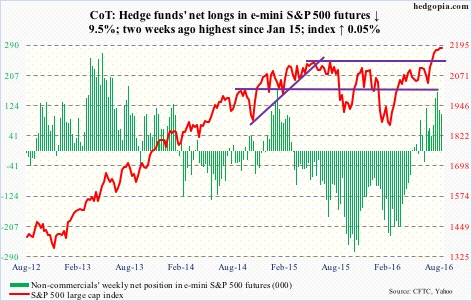
Euro: On its daily chart, the currency looks to want to go lower. It is the opposite on the weekly chart. Its near-term fate probably gets decided by which one wins out.
Rather encouragingly for euro bulls, both 50- and 200-day moving averages are now going flat. Previously, they were both pointing down.
Currently net short 98.4k, down 5.7k.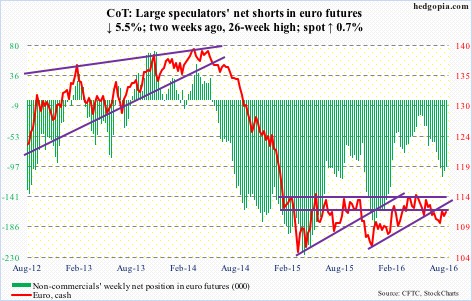
Gold: GLD, the SPDR gold ETF, continued to attract funds. In the week ended Wednesday, $135 million came in. This followed inflows of $680 million (courtesy of ETF.com).
The problem is, the metal has gone sideways in the last couple of weeks … as a matter of fact, in the last several. Too soon to say if it is digesting recent gains, or fatigue is setting in. Weekly indicators are overbought.
Non-commercials continue to remain heavily net long, though under pressure a tad of late. Gold bugs’ worst possible nightmare: unwinding of these longs.
Currently net long 286.4k, down 7.7k.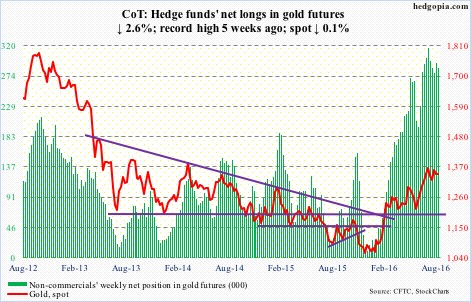
Nasdaq 100 index (mini): Came within three points of the March 2000 all-time high of 4816.35. Flows are helping.
In the week ended Wednesday, QQQ, the PowerShares Nasdaq 100 ETF, attracted $130 million, coming on the heels of cumulative inflows of nearly $2 billion in the prior two (courtesy of ETF.com).
Non-commercials are right there with these longs, having increased net longs to a near three-year high.
Incidentally, the index is at the top of a megaphone pattern.
Currently net long 131.6k, down 34.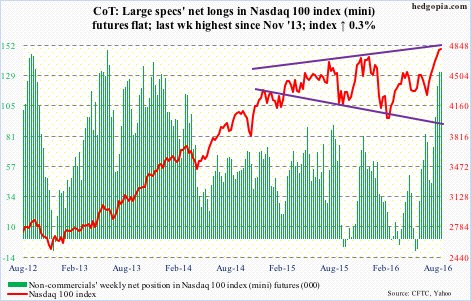
Russell 2000 mini-index: Rallied to 1235.78 but was unable to hold on to the gains. Nevertheless, the index is still above the breakout point of 1210-ish, albeit barely.
The fact that in the week ended Wednesday $2 billion moved into IWM, the iShares Russell 2000 ETF, and the Russell 2000 went down 0.1 percent in the week probably suggests some distribution taking place. The week produced a doji.
Plus, the net-shorts tailwind has been depleted.
Currently net long 2.5k, up 4.7k.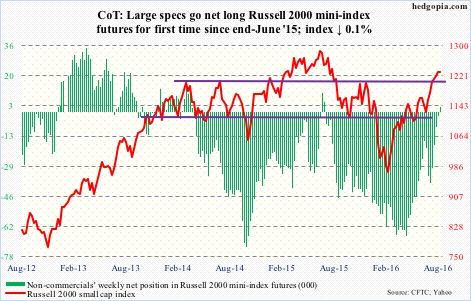
US Dollar Index: Has traded within a rising channel in the past three months, and is currently at the bottom end of that. In a larger scheme of things, the dollar index continues to remain range-bound between 93 and 101.
Given non-commercials’ continued hesitancy toward accumulating net longs, the range-bound action probably continues, or at least not break out of it anytime soon.
Currently net long 15.8k, down 1.9k.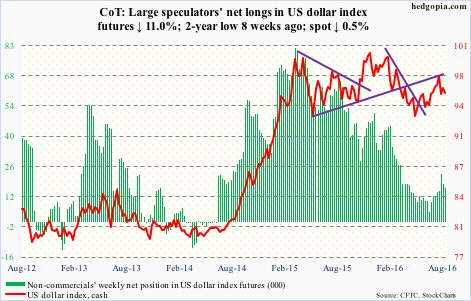
VIX: Seven and counting. That is the number of weeks the VIX-to-VXV ratio has been in oversold territory, with the last five in the mid to high 0.70s and the first two in the low 0.80s.
The VXST (nine days)-VIX (30 days)-VXV (three months)-VXMT (six months) curve continues to remain in contango.
And in four out of the five sessions last week, spot VIX closed under 12, pretty much hovering near the lower Bollinger band all week. The week produced a doji.
Last week, volatility bulls missed an opportunity to force a bullish crossover between 10- and 20-day moving averages. Another is at hand.
Currently net short 118.8k, up 4.2k.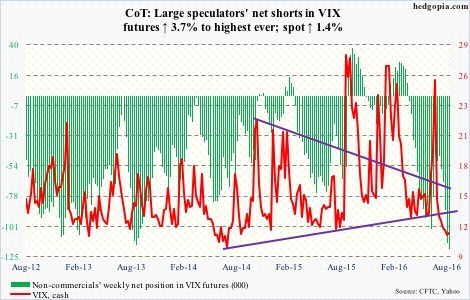
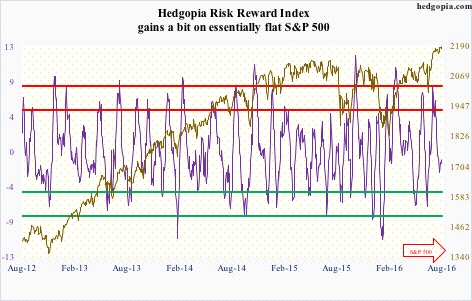
Hedgopia Risk Reward Index