The following are futures positions of non-commercials as of September 15, 2015. Change is week-over-week.
10-year note: When the Fed finally raises rates – whenever that is – ahead of that move should we now pay attention to fed funds futures or two-year yields? In days leading up to Thursday, the former was assigning low odds of a hike this week, even as the latter was yielding 0.82 percent on both Tuesday and Wednesday. As early as August 24, two-year notes were yielding 0.59 percent; post-FOMC decision on Thursday, yields crashed 12 basis points. They were not only wrongly priced but were also in disagreement with the long end of the curve.
Yields on 10-year notes did rise from 2.01 percent on August 24 to 2.3 percent on Wednesday, but were as high as 2.5 percent early June. For the most part, the long end never bought into what the short end was forecasting. On Thursday, TLT, the iShares 20+ Year Treasury ETF, rallied 1.2 percent, and then another 1.5 percent on Friday. The message? No matter what we heaar and read in the media, the economy is not as strong as it is made out to be. The FOMC said as much.
“Recent global economic and financial developments may restrain economic activity somewhat and are likely to put further downward pressure on inflation in the near term,” read the FOMC statement. Four FOMC members do not expect economic conditions to warrant a liftoff until next year or later. One member predicts the fed funds rate will go negative this year and next.
Not sure if a precedent has been set or not, but it is not often the Fed cites global developments as a reason for inaction. A cynic would say they were just looking for a reason not to hike. If they were strictly focused domestically, and were looking to fill their monetary quiver with arrows, they could have moved. On the other hand, one look at, for instance, capacity utilization, which in August (77.6 percent) was more than a point lower than the November 2014 cycle high of 79.04 percent, in all probability they have missed a window of opportunity.
Prior to the FOMC decision, non-commercials continued to add to net shorts.
Currently net short 39.5k, up 15.6k.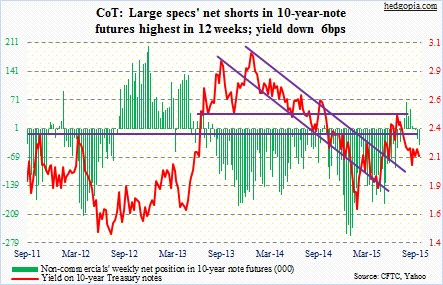
30-year bond: Next week’s major economic releases are as follows.
Existing home sales for August come out on Monday, and new home sales on Thursday. Of late, they have both been relatively strong. At a seasonally adjusted annual rate, sales of existing homes were 5.59 million units in July – the highest since 5.79 million in February 2007. New home sales were 507,000 units in July, with five of the seven months this year north of 500,000. Caution: the pending home sales index inched up to 110.9 in July from 110.4 but was below the May high of 112.3.
The advance report on durable goods for August is published on Thursday. Of late, orders for non-defense capital goods ex-aircraft – proxy for business capital expenditures – have lost momentum. July was $70 billion, versus the $74 billion peak last September. Year-over-year, orders have dropped the past six months.
Friday, we get the third estimate for second-quarter GDP as well as a revised estimate for corporate profits. Real GDP was revised up to 3.7 percent growth in the second estimate, although inventory accumulation contributed nicely. Similarly, corporate profits with inventory valuation and capital consumption adjustments were $2.06 trillion in the second quarter, down from $2.16 trillion in 3Q14. However, profits after tax and without adjusting for inventory and depreciation were $1.82 trillion – an all-time high.
Also on Friday the University of Michigan will release its final consumer sentiment reading for September. The first estimate was disappointing – down 6.2 points month-over-month to 85.7. The recovery high of 98.1 was recorded in January this year – the highest reading since 103.8 in January 2004.
Three FOMC members are scheduled to speak, including Chair Yellen on Thursday; Dennis Lockhart, president of the Atlanta Fed, speaks three different times.
Currently net long 9.5k, up 17.8k.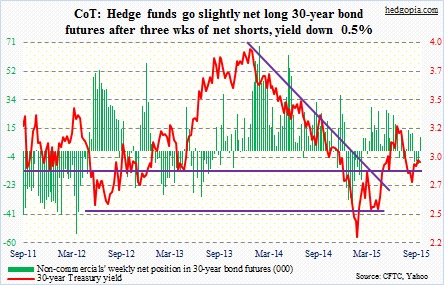
Crude oil: In the week ended September 11, crude inventory fell 2.1 million barrels, to 455.9 million barrels. But gasoline stocks rose 2.8 million barrels, to 217.4 million barrels, and distillates by 3.1 million barrels, to 154 million barrels. On the other hand, Cushing, OK, saw the largest drawdown in seven months – down 1.9 million barrels, to 54.5 million barrels. The week saw a mix of some good, some bad. In the end, spot West Texas Intermediate probably traded along expectations of what might come out of the FOMC meeting. On Tuesday and Wednesday, it rallied 6.8 percent, then fell 3.8 percent in the next two sessions. The crude was right not to expect a hike, but probably did not expect a rather dismal FOMC commentary on global growth.
With that said, it rallied 1.2 percent for the week. The 49-50 level should continue to provide resistance, while support lies at 43-44. Odds favor it breaks to the downside.
Currently net long 285.6k, up 4.2k.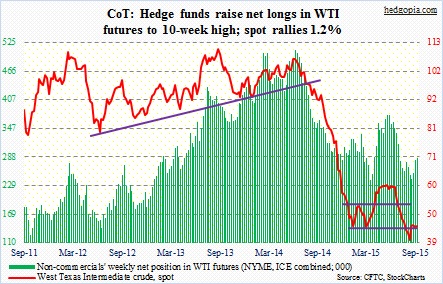
E-mini S&P 500: As per a Bank of America Merrill Lynch survey of fund managers, the percentage of those that are overweight stocks fell to 17 percent this month from 41 percent in August – allocations are at three-year lows. The rather sour mood among investors is also reflected on other polls. Investors Intelligence bulls’ count inched up to 26.8 percent; last week’s 25.7 percent was the lowest since late 2008. American Association of Individual Investors bulls were 33.3 percent, although their ranks have grown from 21.1 percent at the end of July.
Even so, in the September 16th week U.S.-based stock funds attracted $12.7 billion – huge improvement over outflows of $16.2 billion in the prior week (courtesy of Lipper). Funds focused on U.S. shares saw inflows of $11.8 billion, while $835 million went to non-domestic-focused stock funds. This perhaps explains the 2.2-percent jump in the S&P 500 on Tuesday and Wednesday, before an intra-day reversal on Thursday.
Post-FOMC decision and the subsequent confusion among market participants, the path of least resistance for the S&P 500 is probably down – at least in the near-term. Non-commercials raised net shorts to the highest since mid-December 2011.
Moody’s Investors Service, by the way, seems to be throwing cold water on sell-side expectations for a rebound in earnings next year. As of September 10, operating earnings estimates for S&P 500 companies were $130.23, versus $111.54 this year. One reason why 2015 estimates have collapsed this year is what is transpiring in the energy sector. Moody’s is forecasting cash flow for global integrated oil and gas companies (such as Chevron (CVX), Exxon Mobil (XOM) and BP (BP)) is likely to fall by 20 percent or more this year, and that oil and gas prices will stay near recent low levels well into 2016. In other words, not a whole lot of improvement next year.
Currently net short 258.9k, up 32k.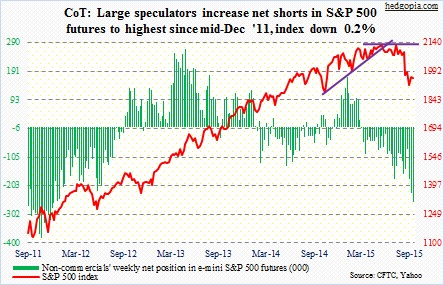
Euro: Eurozone annual inflation was a mere 0.1 percent in August, down from 0.2 percent in July – nowhere near the ECB’s target of just below two percent. This probably helps those wanting to extend/expand the current stimulus program. Currently, the ECB spends €60 billion/month in asset purchases, with a targeted end date of September 2016. Two weeks ago, Mario Draghi, ECB president, said there will be more stimulus, if the need be.
In the meantime, the OECD on Wednesday raised its 2015 growth forecast for the Eurozone by 0.1 percentage point to 1.6 percent, but cut its 2016 forecast to 1.9 percent from 2.1 percent in June.
Currently net short 84.2k, up 3k.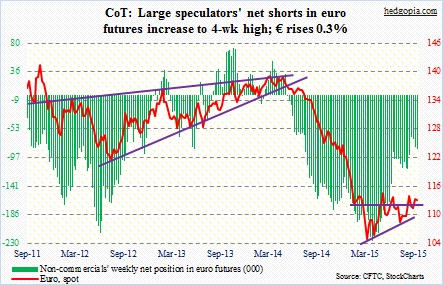
Gold: Kudos to gold bugs for reading the pre-FOMC tea leaves so well! The metal rallied huge on both Wednesday and Thursday, as well as both pre- and post-meeting, ending the week up 2.8 percent.
With this week’s move, the metal, as well as GLD, the SPDR Gold ETF, have moved past their respective 50-day moving averages. If prices stay above for several more sessions, the average could begin to at least go flat.
But can the ETF take out resistance at 110 is the big question? On Friday, it traded as high as $109.38. A convincing break higher will be a significant step as this resistance goes back to November last year.
Currently net long 39.5k, down 19.7k.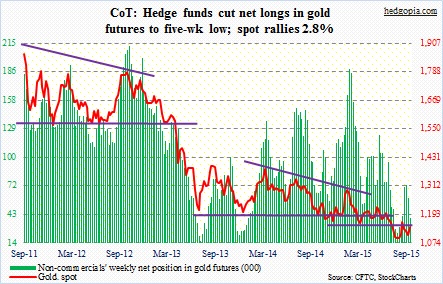
Nasdaq 100 index (mini): Until shortly after Chair Yellen’s press conference on Thursday, the index was up nearly three percent for the week. Then came the late-day reversal, which resulted in a shooting star, followed by another on Friday. Back-to-back shooting stars! The first one was rejected at the 50-day moving average and the second at the 200-day. The index ended the week essentially unchanged. The 4350 resistance is intact. On QQQ, the PowerShares QQQ ETF, the corresponding resistance lies at 105.50, and it closed Friday slightly below that.
Judging by the price action the past couple of sessions, bears clearly have the ball. The poor action was not just limited to the Nasdaq 100. The S&P 500 too had a shooting star on Thursday, followed by a long red candle on Friday; on Thursday, it did not quite get to 2040, where resistance was massive, but did rise to 2021. Similarly, the Dow Industrials was rejected at 17000.
Currently net short 616, down 5.2k.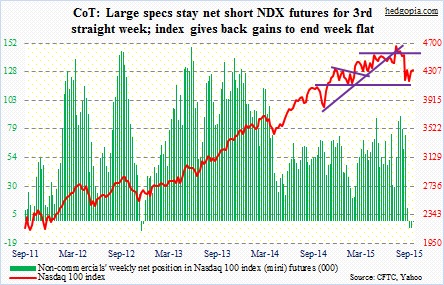
Russell 2000 mini-index: As did the Dow, the S&P 500 and the Nasdaq 100, among others, the Russell 2000 too tested/came close to testing broken support. The 1210 level has been an important support/resistance line since March last year, which the index lost during the sell-off last month. Thursday, it rose to 1194 before reversing. On IWM, the iShares Russell 2000 ETF, the corresponding support lied in the 118-119 range; on Thursday, the ETF rose to 118.89 before reversing. Daily momentum indicators are overbought, and there is plenty of room for unwinding.
Currently net short 34.4k, down 3.1k.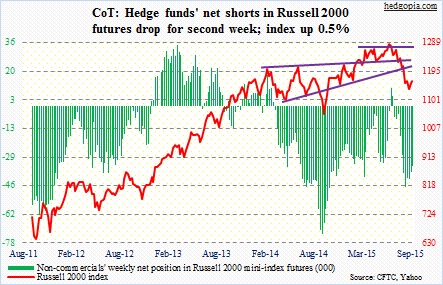
US Dollar Index: Standard & Poor’s on Wednesday lowered its rating of Japan’s sovereign credit by one notch – to A-Plus from AA-Minus. Fitch Ratings took similar action in April, preceded by Moody’s in December. The lesson here? Money-printing is not a panacea.
S&P’s move also did not have adverse impact on the yen, which rose 0.9 percent for the week. The Japanese currency makes up 13.6 percent of the dollar index, which lost 0.2 percent for the week. The greenback was probably disappointed that the Fed did not hike.
Non-commercials continue to trim net longs.
Currently net long 39.8k, down 13.6k.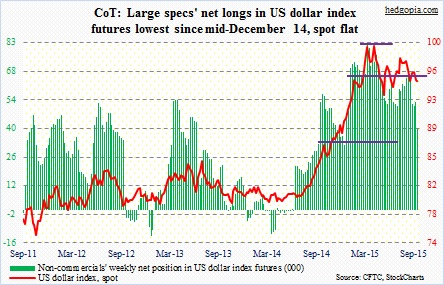
VIX: Non-commercials slightly reduced their holdings, but continued to stay net long for the fourth straight week. These are decent-size positions. Spot VIX has now stayed north of 20 for the fifth consecutive week, and is itching to move higher on a daily chart.
Currently net long 33.2k, down 4.8k.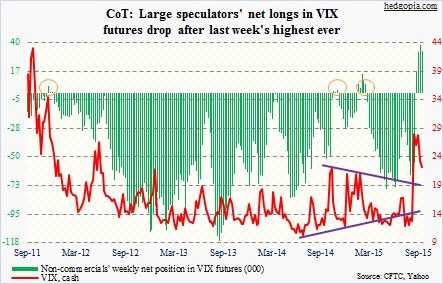
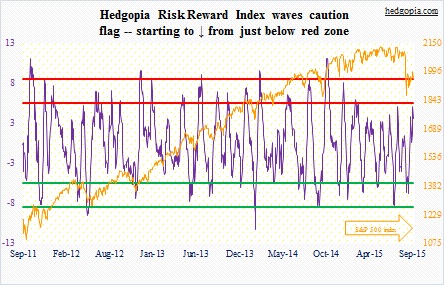
Hedgopia Risk Reward Index