
Following futures positions of non-commercials are as of June 27, 2017.
10-year note: Currently net long 302.1k, down 43.1k.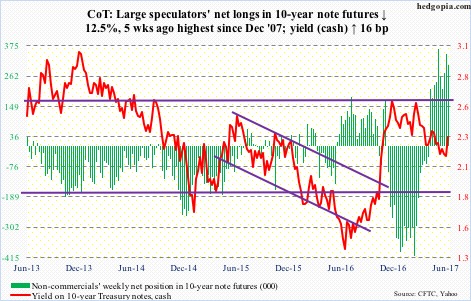
Rising asset prices were once again a talk of the Fed town.
On Tuesday, Janet Yellen, Fed chair, Stanley Fischer, vice-chair, and John Williams, San Francisco Fed president, all reminded us that multiples in stocks and other assets are noticeably high.
Ms. Yellen finds valuations as “somewhat rich” using traditional metrics like price/earnings ratios. Mr. Fischer said increased valuations may reflect greater risk-taking. Mr. Williams said the stock market seems to be running very much on fumes.
As of 1Q17, using trailing 12-month operating earnings, the S&P 500 large cap index traded at an elevated 21.8x.
The question is, what can the Fed do about this? Or, would it? A brief history lesson is in order – and pertinent.
In December 1996, Alan Greenspan, former Fed chief, warned about “irrational exuberance” in stocks. The S&P 500 was at 744 back then, and went on to rally to 1553 by March 2000 before the bubble burst. By October 2002, the index bottomed at 769.
Another bubble got burst in 2007, when the S&P 500 peaked at 1576 in October, dropping to 667 by March 2009.
Current Fed/FOMC officials have the advantage of learning a thing or two from these two bubbles, and the pain wrought by subsequent bursts.
Despite four 25-basis-point hikes since December 2015, with the Fed funds rate at 1.16 percent, monetary conditions remain very accommodative. Stocks, and other asset classes, react to this. Hence the elevated valuations.
If Ms. Yellen is not just paying lip service and serious about it, markets are underestimating the Fed’s resolve to tighten.
30-year bond: Currently net long 54.6k, down 7k.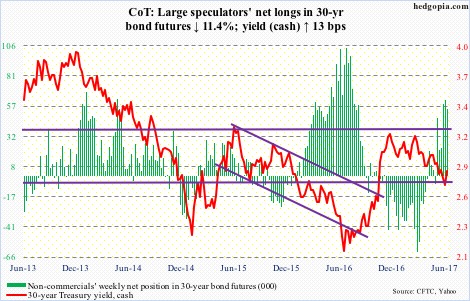
Major economic releases next week are as follows. Happy July 4th!
Monday brings June’s ISM manufacturing index. Manufacturing activity in May inched up one-tenth of a point month-over-month to 54.9. February’s 57.7 was the highest since 57.9 in August 2014. May orders rose two points to 59.5; February’s 65.1 tied the high of December 2013.
May’s revised durable goods data as well FOMC minutes for the June 13-14 meeting come out on Wednesday.
Preliminarily, orders for non-defense capital goods ex-aircraft – proxy for business capital expenditures – fell 0.2 percent in May to a seasonally adjusted annual rate of $62.9 billion. Orders peaked in September 2014 at $70.3 billion.
The ISM non-manufacturing index for June is scheduled for Thursday. May activity fell six-tenths of a point m/m to 56.9. February’s 57.6 was the highest since 58.1 in October 2015. Services orders declined 5.5 points in May to 57.7, with April the highest since 65.3 in August 2005.
June’s employment report is on tap for Friday. May produced 138,000 non-farm jobs. The monthly average in the first five months was 162,000, softer than the 2016 average of 187,000, which in itself was lighter than 226,000 in 2015 and 250,000 in 2014.
Crude oil: Currently net long 365.3k, down 14.2k.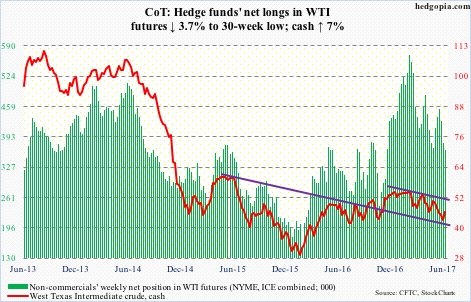
Support at $42-plus on spot West Texas Intermediate crude got defended. This level represents horizontal support going back nearly two and a half years as well as the neckline of a head-and-shoulders formation plus a failing trend line from last October.
Short-covering probably helped.
Oil bulls could also take heart from the fact that the daily MACD just crossed over, and shorter-term moving averages are turning up.
They also took care of the first potential resistance. On November 29 last year, WTI closed at $45.23. The next day, OPEC and non-OPEC nations such as Russia hammered out a deal to cut crude production by 1.8 million barrels per day. By early January this year, it had rallied to/peaked at $55.24, then bottoming at $42.05 seven sessions ago.
Friday, oil rallied to $46.04, up seven percent for the week.
The next level to watch is $47, which also approximates the 50-day. Shorts are likely to get active around here.
The EIA report for the week ended June 23 showed crude production for a change dropped 100,000 barrels/day to 9.25 million b/d. This was the largest week-over-week drop since July last year.
Gasoline and distillate stocks both fell – by 894,000 barrels and 223,000 barrels to 241 million barrels and 152.3 million barrels, respectively.
Crude stocks, on the other hand, rose 118,000 barrels to 509.2 million barrels.
Crude imports rose, too – by 140,000 b/d to 8.02 mb/d.
Refinery utilization fell 1.5 percentage points to 92.5 percent.
E-mini S&P 500: Currently net long 25k, up 16.4k.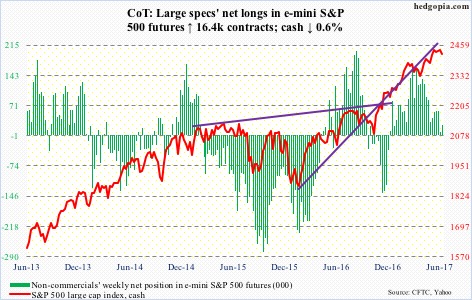
Support at 2400, which also approximates the 50-day, was not going to fall that easy, and it did not. At one time Thursday, the cash was down as much as 1.4 percent but managed to claw its way back to close down 0.9 percent. For the week, it lost 0.6 percent.
The weekly and monthly charts remain grossly overbought, so the above support likely gets tested again. Will flows cooperate with the bulls?
At least in the week ended Wednesday, they did not. U.S.-based equity funds lost $9.7 billion (courtesy of Lipper). This followed outflows of $2.2 billion in the prior week.
In the same week, IVV (iShares core S&P 500 ETF) and VOO (Vanguard S&P 500 ETF) together gained $688 million – $280 million and $408 million, respectively. But this was not enough to offset redemptions of $2.3 billion SPY (SPDR S&P 500 ETF) suffered (courtesy of ETF.com).
Euro: Currently net long 58.7k, up 13.8k.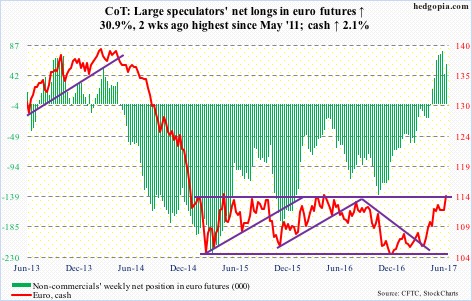
Oversold daily prevailed over overbought weekly conditions. The cash (114.24) rallied 2.1 percent in the week, breaking out of one-month resistance at just under 113. Resistance at 114-plus goes back nearly two and a half years.
Plus, the daily chart is now extended, with the cash closing outside the Bollinger band the past four sessions. Retest of the recent breakout only makes sense.
Gold: Currently net long 131.7k, down 19k.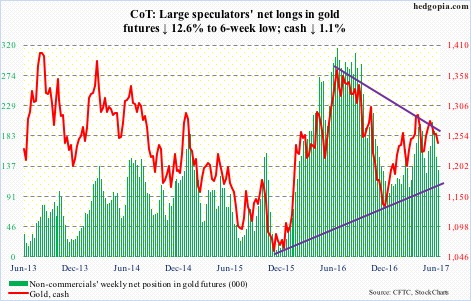
The cash continues to remain trapped between the 50- and 200-day, with the former beginning to point down. A loss of the 200-day also ensures the metal drops below a rising trend line from last December.
Oddly, intraday Thursday, VIX doubled, but this risk-off behavior was not reflected in gold.
From gold bugs’ perspective, the problem is that flows continue to remain tentative. In the week to Wednesday, GLD (SPDR gold ETF), lost $11 million (courtesy of ETF.com).
Nasdaq 100 index (mini): Currently net long 51.2k, down 19.7k.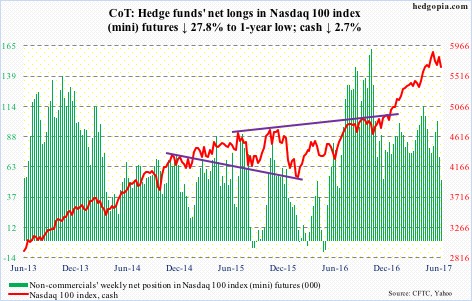
The cash – down 2.7 percent for the week – became the first among its major U.S. peers to lose the 50-day. The weekly chart just completed a bearish MACD cross-under, and produced another bearish engulfing candle.
Flows are not helping, even as non-commercials have been cutting back net longs.
In the week through Wednesday, $799 million was withdrawn from QQQ (PowerShares Nasdaq 100 ETF). In the prior three, $742 million came out.
Thus far, shorts have been vindicated. Mid-June QQQ short interest was up 27.4 percent period-over-period – and up 56.6 percent since the end of March this year.
Russell 2000 mini-index: Currently net short 16.6k, up 1.2k.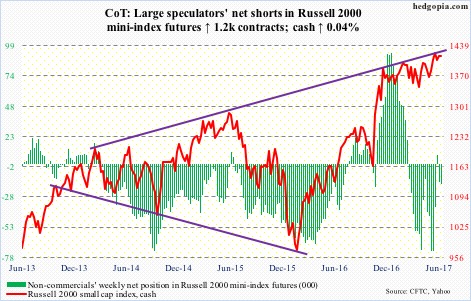
Mid-June short interest on IWM (iShares Russell 2000 ETF) fell 10 percent p/p to 95.4 million – a five-month low, reducing odds of a squeeze.
Bulls once again tried to break the cash out of a two-month range, but were unsuccessful. They are also having to tussle with the bears over control of shorter-term averages.
In the week ended Wednesday, IWM, the iShares Russell 2000 ETF, lost $810 million (courtesy of ETF.com). This was the first withdrawal in the last five weeks.
US Dollar Index: Currently net long 5.5k, down 162.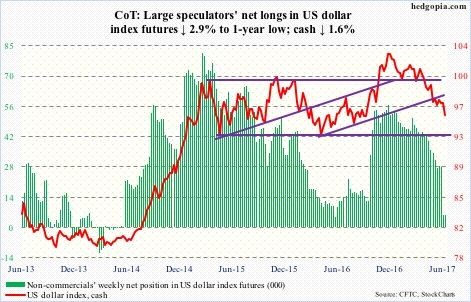
Daily overbought conditions combined with the inability of the cash last week to rally past near-term resistance at 97.3 proved costly. It fell 1.6 percent this week.
In the last four sessions, the dollar index (95.42) closed outside the daily Bollinger band – oversold, yes, but needs to stabilize.
In the event of a rally, the level to watch is 96.50-ish.
At least until Tuesday, non-commercials continued to show disinterest, with net longs at a one-year low.
VIX: Currently net short 135k, down 8.8k.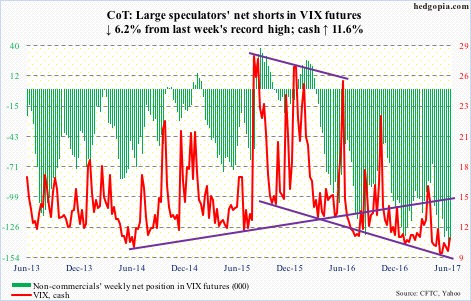
After four consecutive sessions of sub-10 intraday readings, Thursday saw spot VIX surge to 15.16 before giving up most of the gains to close the session up 1.41 points to 11.44.
Intraday Thursday, the spread between VXST, which measures S&P 500 volatility for nine days, and VXMT, which does the same but goes out six months, was in backwardation before getting back into contango by close.
If this week’s sudden jump in volatility is any indication, interesting times lie ahead.
Thanks for reading! Please share.
