
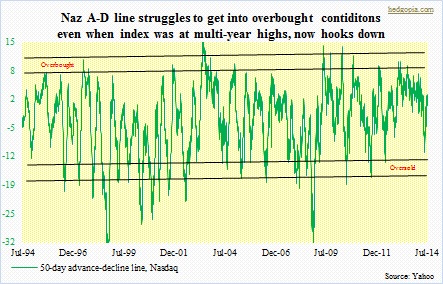
 Enough ink has been spilled on how in recent months major indices – and sectors/industries within them – have been diverging from each other. For two and a half months beginning late February/early March, previously risk-on favorites such as solar, biotechs, and small-caps totally came unglued, even as the S&P 500 and Dow Industrials held up better; the latter two eventually went on to notch highs after highs. In a similar fashion, the Nasdaq early this month traded at the highest level since 2000, nevertheless breadth has been awfully narrow, and progressively getting narrower. As a matter of fact, as the accompanying chart shows, for over a year now the Naz advance-decline line has been making lower highs. Heavy-lifting is done by the likes of AAPL (up 22 percent year-to-date), CSCO (up 18 percent), INTC (up 33 percent) and MSFT (up 22 percent). This obviously comes with risks. So long as large-caps attract bids, the index acts fine. As such heavy-weights start going sideways – or start coming under pressure – the index falls under its own weight. We are probably in the midst of one right now. The afore-mentioned stocks, or others like them, are yet to crack, yet, overall, grossly overbought technicals, giddy sentiment indicators, and a lack of dry powder all point to impending weakness. The only saving grace is short interest, which continues to stay elevated and should help create floor.
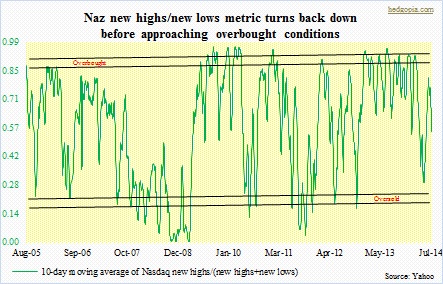 The first signs of trouble probably came on Monday when the Russell 2000 Small Cap Index reversed intra-day failing to hold a 1.2-percent oversold rally. Near-term indicators are now oversold, but medium-term continues to stay overbought, so for the next few days, or a week or so, it is a matter of who wins the battle – near- or medium-term? Beyond that, there is much more to go before the overbought conditions these indices are in are unwound. And as the chart above shows, once a process of unwinding begins, more often than not the A-D line ends up in oversold territory, or thereabouts. Ditto with the chart nearby. The Nasdaq new highs-new lows metric began to turn back down a month ago even as the index went on to add another 100 points since. One more example of ongoing divergence. There is still some way to go before this metric gets to oversold conditions. Put another way, conditions are ripe for weakness ahead for equities in general. Let us see if bears can press their case. One thing that needs close monitoring is the VIX, which shot up 32 percent yesterday! That is too big a jump in one day. Yes, some untoward incidents did take place internationally, but probably not as bad to deserve that kind of a jump. In the past, a spike reversal in the VIX has been a place to go long.
