
In the latest reporting period, U.S. equity shorts made it big. But rather than covering, they added more. It remains to be seen if they will continue to win out or are setting themselves up for a mini squeeze.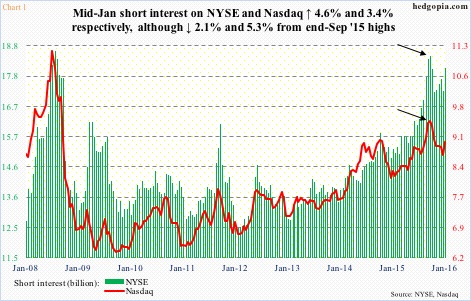
During the two-week period ended January 15th, the Nasdaq composite dropped 10.4 percent, and the NYSE composite 8.3 percent. Short interest went up 3.4 percent and 4.6 percent period-over-period, to 8.97 billion and 18.04 billion, respectively (Chart 1).
Short interest remains relatively high on both indices.
This was the first time since September last year shorts have been amply rewarded for bearishness. On the 15th, indices were still under pressure, though some, like the Nasdaq composite, were beginning to show signs of exhaustion. This probably led shorts not to cover.
This behavior is evident across several ETFs.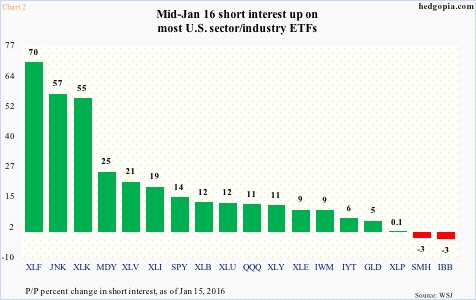
In Chart 2, of 18 sector/industry ETFs, short interest only declined on two – that too by a modicum amount. The rest are all up, some huge. On XLF, the SPDR Financials ETF, it surged 70 percent!
Yesterday, XLF (21.12) essentially closed near where it closed on the 15th (21.42). The ETF did drop to 20.99 on the 20th – the day it, and stocks in general, staged a massive reversal – but shorts’ bet to continue to stay bearish has not quite panned out.
That is the risk these shorts face. Indices are now oversold on a weekly basis. In the right circumstances, unwinding of these conditions can be self-fulfilling, as was the case when stocks bottomed in late September last year before rallying hard. The S&P 500 jumped 13 percent in five weeks after that trough.
That said, here is a crucial difference. Shorts are nowhere near as aggressive as they were back then. On both the Nasdaq and NYSE, short interest is lower (arrows in Chart 1).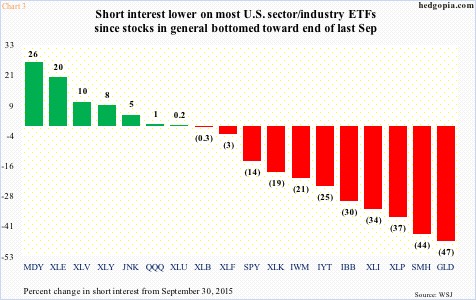
Once again, this holds true with most indices and ETFs. Chart 3 plots the percent change in short interest from the September 30th period. Two weeks ago, this graph looked much redder. Less so now, nonetheless there is plenty of red still.
This probably suggests that the potential fuel for short squeeze is not as strong as was toward the end of September. This scenario fits in with several technical indicators suggesting limited upside potential for indices. In a perfect scenario, the S&P 500, for instance, rallies but will face massive resistance at 1990.
In a worse-case scenario for stocks, Jan 20th lows get revisited in the next several sessions. In all probability, shorts will/should use that as an opportunity to cover and wait for another opportunity to strike. The way 2016 is shaping up, there will be plenty this year.
Thanks for reading!
