The following are futures positions of non-commercials as of September 22, 2015. Change is week-over-week.
10-year note: Last week, post-FOMC decision not to hike, stocks fell. They had rallied strongly into the meeting, and were probably set to drop either way – hike or no hike. But the drop seems to have created an impression – probably false – that stocks are begging for the Fed to tighten.
The FOMC statement last week could not possibly have been more dovish. But in weekend comments, Fed officials’ tone was leaning hawkish. John Williams, president of the San Francisco Fed, said last week’s decision was a “close call.” James Bullard, president of the St. Louis Fed, said “the case for policy normalization is quite strong.” Jeffrey Lacker, president of the Richmond Fed, reminded us that “interest rates have been near zero for over six years.”
Then on Thursday, Janet Yellen, Federal Reserve chair, said this: “Most of my colleagues and I anticipate that it will likely be appropriate to raise the target range for the federal funds rate sometime later this year and to continue boosting short-term rates at a gradual pace thereafter as the labor market improves further and inflation moves back to our two percent objective.” Of course, she hedged all this by saying they would continue to be data-dependent.
On Friday, two-year yields, which tend to be the most sensitive to Fed policy, only rose three basis points to 0.70 percent; they were 0.82 percent right before the FOMC decision last week. In fact, 10- and 30-year yields rose four and five basis points, respectively. Not sure what the message is – if there is any.
On a side note, did John Boehner just make Ms. Yellen’s job harder?
Non-commercials significantly cut back net shorts – betting on lower rates. Although, ten-year yields are oversold near-term.
Currently net short 8.5k, down 30.9k.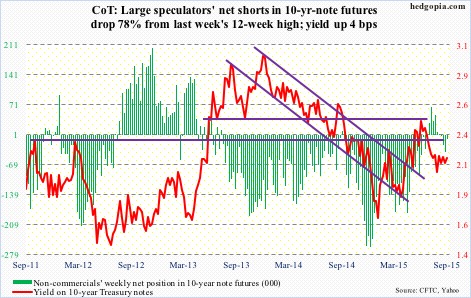
30-year bond: Next week’s major economic releases are as follows.
On Monday, August’s personal income is published. All eyes will be focused on the PCE deflator – the Fed’s favorite measure of consumer inflation. In July, core PCE rose 1.2 percent annually – the lowest since March 2011. The last time it rose at a two percent annual rate was in April 2012.
Also on Monday, we get the pending home sales index for August. This correlates well with existing home sales. July came in at 110.9, up slightly from 110.4 in June, but down from 112.3 in May, which was the highest since 112.5 in May 2006. In August, sales of existing homes fell by 4.8 percent month-over-month. July sales of 5.58 million (seasonally adjusted annual rate) were the highest since 5.79 million in February 2007.
The ISM manufacturing index for September comes out on Thursday. August was 51.1 – the lowest since 50 in May 2013. The new orders index was 51.7 – the lowest since 49.6 also in May 2013.
Friday, we get the all-important employment report for September and factory orders. The advance report on durable goods was published this week. Next week, we get revised and more detailed estimates, as well as non-durable goods data. There is no momentum in this series. Year-over-year, orders for non-defense capital goods ex-aircraft – proxy for business capital expenditures – have dropped for seven straight months.
On the employment front, August was weak – saw a mere 173,000 non-farm jobs, versus a monthly average so far this year of 212,000, which itself is much weaker than the 2014 average of 260,000. Average hourly earnings of private-sector workers rose a healthy $0.08 to $25.09. With that said, annual growth is stuck around two percent, give and take.
10 FOMC officials are scheduled to speak on weekdays, including Ms. Yellen, Stanley Fischer, Fed vice chair, and Bill Dudley, president of the New York Fed. Get ready to get confused.
Currently net long 7.7k, down 1.8k.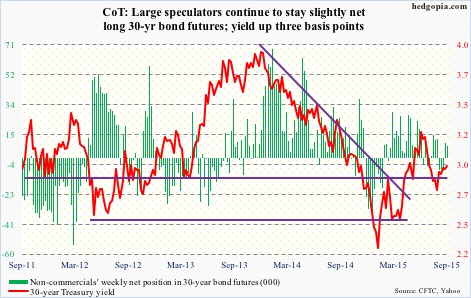
Crude oil: In the week ended September 18, crude inventory fell by 1.9 million barrels, to 454 million barrels. This came on the heels of a drop of 2.1 million barrels last week. Other data were not as encouraging.
Crude production rose 19,000 barrels a day, to 9.14 million barrels a day (it peaked at 9.61 mb/d in the June 5th week). Refinery utilization rates fell 2.2 percentage points to 90 percent. Gasoline stocks rose 1.4 million barrels, to 218.8 million barrels; they have risen by six million barrels in the past five weeks. It is a double whammy – an end to the summer driving season even as refineries shut down for maintenance.
Globally, end-demand could be better.
The preliminary Caixin/Markit China PMI fell to 47 in September – the lowest since March 2009. South Korean exports shrank 14.7 percent from a year earlier in August. China’s was down 6.1 percent in that month, Taiwan’s down 14.8 percent. You get the picture.
In the end, the positive rig count news on Friday was not much help to oil. U.S. oil rig counts declined by four to 640 – a fourth weekly decline. Counts are now at a 10-week low.
The WTI was flat for the week. In three of the past four weeks, it has been rejected by its 13-week exponential moving average. The path of least resistance is down, with 43-44 a must-hold; that level did provide support on Thursday.
Non-commercials are optimistic, with net longs at an 11-week high.
Currently net long 295.6k, up 10.3k.
E-mini S&P 500: Back in March, the S&P 500 had a bearish monthly MACD crossover. This does not happen that often. In the current bull market, there was a brief crossover in late 2011, and before that in late 2007 and in late 1999. The March crossover, it turns out, was prescient.
Fast forward to the present, and now there is another similar rare occurrence about to flash a bearish signal. The last time the index dipped below its 20-month exponential moving average was four years ago – or in January 2008 and in November 2000 before that. With three sessions remaining in the month, the index is 33 points below that average. Can it be saved?
As things stand now, it is bears’ ball to lose, and they are pressing it. As of mid-September, short interest on SPY, the SPDR S&P 500 ETF, shot up 17 percent period-over-period to 437 million, and has gone up 40 percent in the past month. This is a potential catalyst for short squeeze IF bulls are able to regroup. This is not a scenario envisaged by non-commercials, who are staying with massive net shorts.
Currently net short 240k, down 18.9k.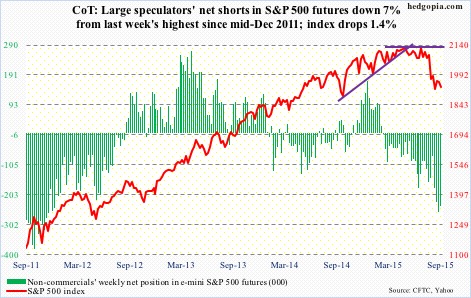
Euro: If ECB officials were trying to one up their Fed counterparts this week, they probably succeeded. Several of them spoke, each with their own take on possible expansion of stimulus. Currently, the ECB spends €60 billion/month in asset purchases, with a targeted end date of September 2016.
On Monday, ECB chief economist Peter Praet said that the bank has tools needed to anchor inflation expectations, reiterating its readiness to modify the existing bond-buying program should economic turbulence merit action. The euro dropped one percent that day.
Then on Wednesday, Ewald Nowotny, head of the Austrian central bank, said he was wary of increasing stimulus any time soon. He spoke before Mario Draghi, ECB president. The latter essentially said it was too soon to say if economic weakness warranted additional stimulus, and that the bank needed more time before deciding on further stimulus. The currency rallied 0.5 percent that day.
Non-commercials continue to lean bearish, though not to the extent they were early this year.
Currently net short 81k, down 3.2k.
Gold: On Thursday, the spot rallied 2.1 percent to $1,153.30, taking out resistance at $1,140. On GLD, the corresponding resistance lies at $110, and it closed Thursday at $110.49, having risen to $110.82 intra-day. Friday was different. Interest rates rose, the dollar rose, and the yellow metal went the other way. It was not able to build on Thursday’s jump, but it is literally sitting on that resistance.
Looking at a weekly chart, there is room for it to move higher but daily momentum indicators are getting overbought. The good thing – from gold bugs’ perspective – is that the 50-day moving average is no longer dropping, and on Tuesday provided support. On GLD, 50 DMA lies at $107.
Non-commercials actively added to net longs.
Currently net long 61.1k, up 21.6k.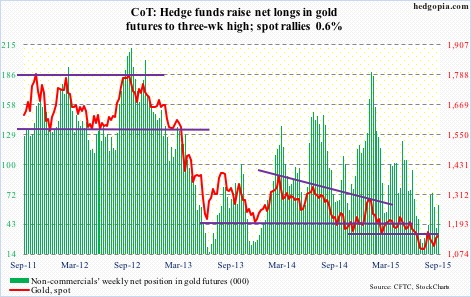
Nasdaq 100 index (mini): Here are some interesting tidbits from FactSet. AAPL spent $10 billion in stock buybacks last quarter, and led the pack. In all, information technology companies spent $35.9 billion. Four of the top 10 were IT companies – with QCOM spending $4.4 billion, MSFT $4.2 billion, and ORCL $2 billion. Total buybacks by S&P 500 companies were $134.4 billion, down 6.9 percent q/q and down 0.4 percent y/y. Overall, the number of companies repurchasing shares fell from 390 to 378 q/q. Here is the bad news in all this: S&P 500 companies are spending more on buybacks than they are generating in free cash flow. The buybacks-to-free cash flow ratio was 108 percent during the quarter. This is not sustainable. Buybacks have been a significant source of buying power that has kept this bull market alive. This is another one of several indicators that are currently at inflection points.
Currently net long 9k, up 9.7k.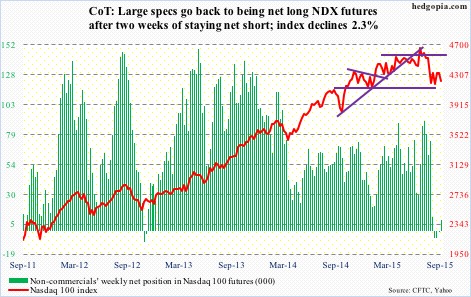
Russell 2000 mini-index: Small-caps essentially gave a thumbs-down to the Janet Yellen speech. On Friday, the opening strength was sold right off the bat, and the Russell 2000 never got going, even as large-caps were holding their own in the early going. By nature, small-caps are domestically oriented. Is this their way of saying they would not be able to cope with higher rates? Alternatively, it is possible they simply followed the bio-techs, where early strength was sold off hard. IWM, the iShares Russell 2000 ETF, shed 1.3 percent.
Recall that last week the Russell 2000 nearly tested the broken March 2014 horizontal resistance, and was rejected.
Non-commercials have been cutting back net shorts the past three weeks.
Currently net short 27.7k, down 6.7k.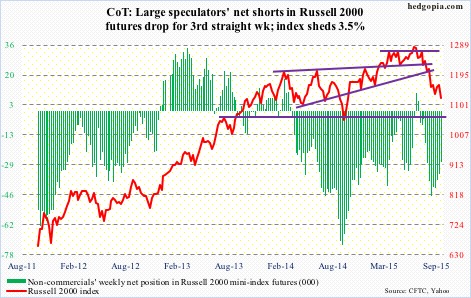
US Dollar Index: With commentary from several central bank officials during the week, the dollar index had its share of roller-coaster ride, even though it ended the week up 1.5 percent. On a daily chart, it is itching to go lower. But here is the thing. It remains trapped between 50- and 200-day moving averages, with the former beginning to decline and the latter still slightly rising. A decision time will soon be upon us.
Non-commercials are not as gung-ho as they were early this year, when they were actively adding to net longs, which peaked at north of 81,000 contracts in March. Now holdings are half that. In the past, these traders have done a good job of riding the ups and downs in the dollar.
Currently net long 40.8k, up 1k.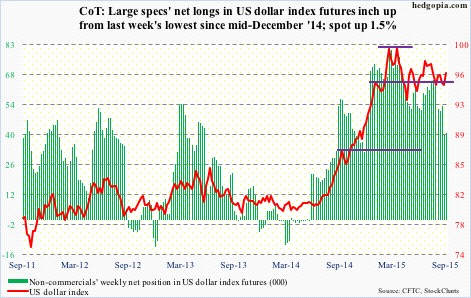
VIX: Six and counting! That is the number of weeks spot VIX has closed above 20. Yes, it has been more than cut in half from the August 24th high of 53.29, but it continues to attract bids north of 20. This has to dishearten equity bulls. Consolation: Non-commercials have been cutting back net longs the past couple of weeks.
Currently net long 24.8k, down 8.3k.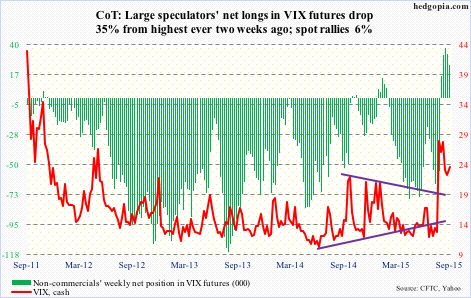
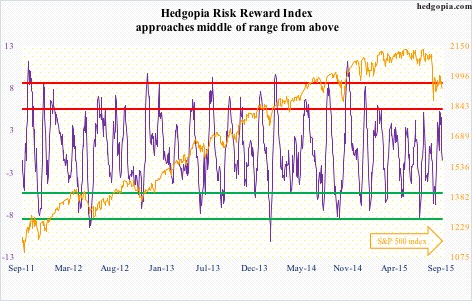
Hedgopia Risk Reward Index