The following are futures positions of non-commercials as of May 10, 2016. Change is week-over-week.
10-year note: Three FOMC voting members were on full jawboning mode on Thursday.
Eric Rosengren, Boston Fed president, said markets are underestimating the likelihood of rate hikes. He sees risks from the Fed keeping rates too low, too long.
Loretta Mester, Cleveland Fed president, said the Fed should recognize that there is uncertainty in its economic forecasting but that should not stop it from taking monetary policy decisions.
Then Esther George, Kansas City Fed president, said interest rates are too low for the current U.S. economy, adding that she backs gradual rate hikes.
Hawkish message from all three. Fed funds futures did not budge. The bond market continues to act sanguine, with the 10-year dropping seven basis points for the week to 1.71 percent.
Currently net short 79.3k, down 2.8k.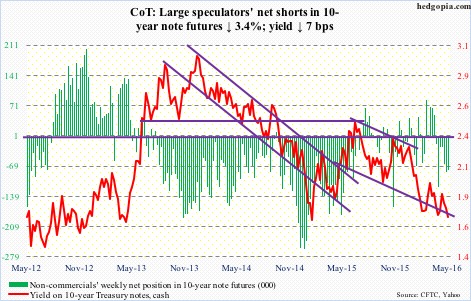
30-year bond: Major economic releases next week are as follows.
Monday brings May’s NAHB/Wells Fargo housing market index. Builder sentiment has been stuck at 58 the past three months. The cycle peaked at 65 last October, which was a 10-year high (69 back then).
Also on Monday comes out Treasury International Capital System data for March. February saw another $11.1 billion in foreign sales of U.S. equities, with the 12-month running total of $138.9 billion – the largest ever.
On Tuesday, we get the consumer price index (April), housing starts (April), and industrial production (April).
In March, both CPI and core CPI rose 0.1 percent month-over-month. In the 12 months through March, headline CPI decelerated to 0.9-percent increase from one-percent rise in February; similarly, core CPI rose 2.2 percent, slower than 2.3-percent increase in February.
In March, industrial production contracted 0.6 percent m/m, following a similar decline in February. Annually, it fell two percent… this was the seventh straight year-over-year decline. Capacity utilization in March was 74.8 percent, a full four points lower than the cycle peak 78.9 percent in November 2014. Utilization has dropped for 13 consecutive months.
FOMC minutes for the April 26-27 meeting are published on Wednesday.
Existing home sales for April will be reported on Friday. Sales rose 5.1 percent in March to a seasonally adjusted annual rate of 5.33 million units, after a 7.3-percent drop in February. The July 2015 cycle peak of 5.48 million stays. The median price was $222.7k in March, merely six percent from the all-time high $236.3k last June.
Three FOMC members are scheduled to speak during weekdays.
Currently net long 50.7k, up 5.7k.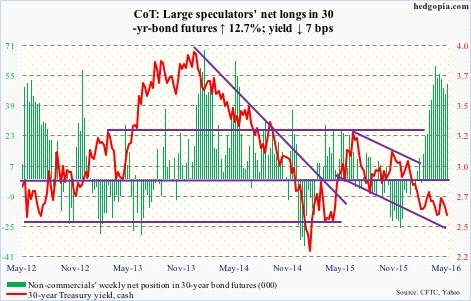
Crude oil: Global oil markets are heading towards an equilibrium, says the International Energy Agency.
OPEC is not seeing a decline in production, non-OPEC is.
OPEC member Iran’s crude oil production apparently jumped to 3.6 million barrels per day, back to pre-2012 sanction levels. And it is seeking to win back market share. On Tuesday, it cut crude prices versus Saudi Arabia and Iraq, setting the June official selling price for Iranian heavy crude at $1.60 a barrel below the Oman/Dubai average.
At least in the U.S., production is declining. For the week ended May 6th, production fell 23,000 b/d to 8.8 mb/d. This was the fifth consecutive sub-nine mb/d. Production peaked at 9.61 mb/d in the June 5th week last year.
Help also came from crude imports, which dropped 5,000 b/d to 7.7 mb/d.
Stocks were down as well. For the first time in five weeks, crude inventory fell – by 3.4 million barrels to 540 million barrels. The preceding week’s total was a mere 1.8 million barrels from the all-time high 545.2 million barrels in October 1929.
Gasoline and distillate stocks fell as well – the former by 1.2 million barrels to 240.6 million barrels, and the latter by 1.6 million barrels to 155.3 million barrels.
The only downer was refinery utilization which fell six-tenths of a percentage point to 89.1 percent.
Spot West Texas Intermediate crude continued to rally – up 5.3 percent for the week. Kudos to oil bulls who for the third week running defended $43.50 support.
Currently net long 295k, down 24k.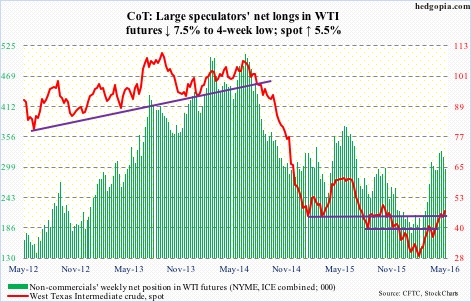
E-mini S&P 500: Last Friday, bulls stepped up to defend the 50-day moving average, but were unable to hang on to the two-plus percent rally through Wednesday. Come Thursday, that average was tested again, with the session producing a spinning top. Friday, it was lost.
At least on SPY, the SPDR S&P 500 ETF, short interest increasingly is less of a tailwind. As of April 29th, short interest dropped 4.6 percent period-over-period to 237.9 million shares – the lowest since the end of March last year.
The ETF continued to see outflows, losing $9.5 billion in the nine sessions ended Tuesday. Then on Wednesday, it saw inflows of $3.2 billion. As a result, in the week ended Wednesday, flows were slightly positive – $77.6 million. That said, Wednesday was also a session the S&P 500 lost nearly a percent. A case of smart money leaving when the going is good?
In fact, Lipper data shows, another $6.1 billion left U.S.-based equity funds in the week ended Wednesday. This followed outflows of $11.2 billion in the prior week.
Currently net long 19.7k, up 9.6k.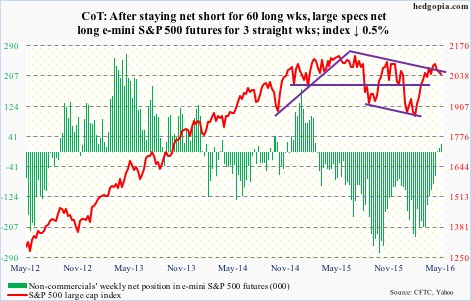
Euro: Greece is back in the news.
Eurozone finance ministers held an emergency meeting on Monday to discuss the possibility of further debt relief for Greece, aiming to reach a deal by May 24th, when they meet next.
At present, Greece’s creditors are at a stalemate. Further, Brussels needs to release bailout funds to Athens. Greece has had three international bailouts. At the end of 2015, its debt was 177 percent of GDP. Would it ever be able to repay this debt without relief, and would Germany agree to debt relief? The whole situation is in a pickle.
As for now, last week produced a shooting star, and the break out of 114-114.50 has so far proven to be false. This Wednesday, that resistance was attacked again, once again unsuccessfully. Friday saw the currency testing its 50-day moving average (112.94).
Weekly indicators in particular are grossly overbought, and odds favor the euro proceeds to unwind these conditions.
Currently net short 21.9k, down 1.7k.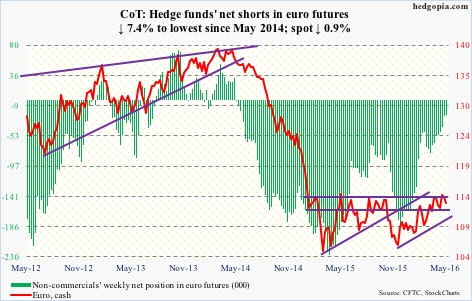
Gold: Hedge fund titans Paul Singer, of Elliott Management, and Stan Druckenmiller, formerly of Duquesne Capital, versus Goldman Sachs. The former two are big believers in gold’s prospects as, in the words of Mr. Singer, “central bankers are completely focused on debasing their currencies.” The latter, in a May 10th note, expects gold ($1274/ounce) to reach $1,150 in a year, although it raised its forecast from prior $1,000.
Whatever gold’s prospects – or a lack thereof – medium- to long-term, the metal continues to be range-bound. Has been that way the past three months. In late April, it broke out of the range, and is struggling to save it.
It is worth remembering that gold demand surged 21 percent in 1Q16 – the fastest pace on record, according to the World Gold Council. GLD, the SPDR gold ETF, attracted $2.7 billion during the quarter. All this perhaps in anticipation of a convincing breakout, which is yet to occur.
At present, the metal is bound by its 10-day moving average, which is beginning to roll over. Ditto with the 50-day moving average, which is slightly rising to flat. Time for gold bugs to step up to the plate.
Currently net long 264.9k, down 6.8k.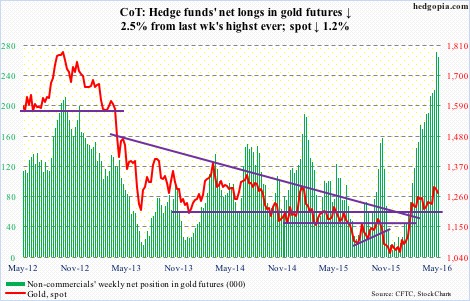
Nasdaq 100 index (mini): To say that Apple (AAPL) is no longer the apple of investors’ eyes is probably not stretching it.
Over persistent concerns of slowdown in iPhone sales, it broke 92 this week. This support goes back to June 2014, or even September 2012. At 11.7 percent of QQQ, the PowerShares Nasdaq 100 ETF, AAPL still has outsize impact on the index. And it shows.
Early on this week, the Nasdaq 100 was able to build on last Friday’s intra-day reversal, and at one point was up 1.8 percent for the week. Wednesday’s rally attempt was vehemently denied by the 200-day moving average, with the 50-day right above. The session saw $483 million in inflows into QQQ, which is now underwater. For the week ended Wednesday, inflows were $447 million (courtesy of ETF.com).
As things stand, 4350 continues to be the line in the sand – rejected again on Friday.
Currently net short 9.3k, down 18.7k.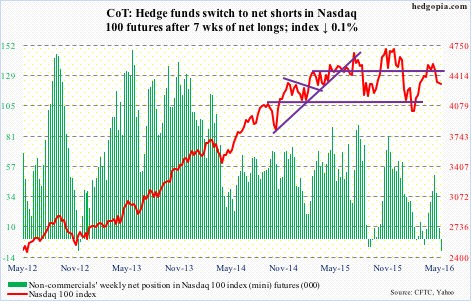
Russell 2000 mini-index: Unlike on the S&P 500 or the Nasdaq 100, a golden cross never completed on the Russell 2000. The 200-day moving average continues to drop, even as the 50-day is rising but with decreasing steepness. The index is now below both.
To recall, April’s high kissed the belly of a broken trend line drawn from March 2009, and was rejected. In a larger scheme of things, this is a major failure. Plus, last week, the Russell 2000 lost dual support – at 1120-ish – horizontal line going back to September 2013 as well as two-month channel. The latter resistance was tested this Thursday, but met with failure. This is where the 200-day lies.
For the week, it dropped 1.1 percent, and the weakness came amidst inflows of $310 million into IWM, the iShares Russell 2000 ETF, in the week ended Wednesday (courtesy of ETF.com).
On a weekly basis, conditions are overbought. The path of least resistance is down.
Currently net short 45.7k, down 3.3k.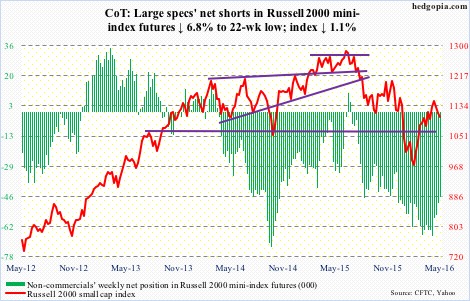
US Dollar Index: The Bank of Japan’s aggressive quantitative easing (QE) program has expanded Japan’s money supply threefold.
In October 2011, a U.S. dollar bought 75.54 in Japanese yen. By June of last year, the yen had weakened to 125.85. Then it started to rally, rising to a low of 105.52 last week. It has weakened since that low, but the yen’s strength in the past year despite negative interest rates and oodles of QE money have to be rubbing Japanese officials the wrong way.
On Tuesday, Japanese finance minister Taro Aso warned that one-sided moves in the Japanese yen would not be tolerated. Should the ministry seek to weaken the yen, the dollar index is a beneficiary. The yen makes up 13.6 percent of the index.
This week, dollar bulls built on last week’s hammer reversal candle. The 93.50 level has been defended, with shorter-term moving averages beginning to hook up. Weekly conditions are way oversold.
Currently net long 12.1k, up 2.9k.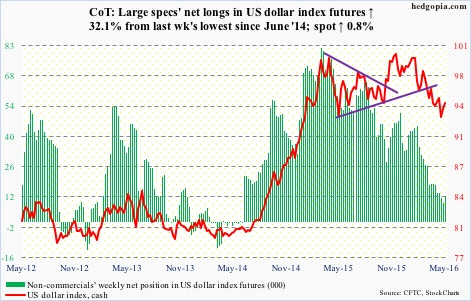
VIX: For nearly two months now, spot VIX has been hammering at resistance at 16-17, which goes back two decades. In the past, once this gets taken out, VIX has shown a tendency to rally – rally good.
In this context, the longer end of the VXST (nine days)-VIX (30 days)-VXV (three months)-VXMT (six months) curve is steep, which probably suggests markets are bracing for higher volatility in the second half of the year (more on this here).
In this scenario, the VIX-to-VXV ratio is like a compressed spring, with four of the past nine weeks in 0.70s and three in low 0.80s.
Currently net short 88.1k, up 10.6k.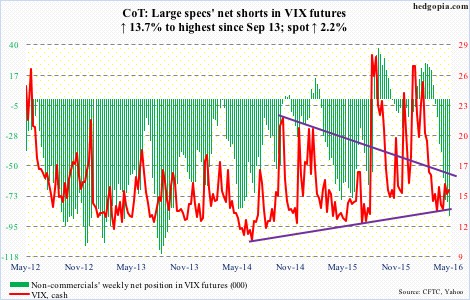
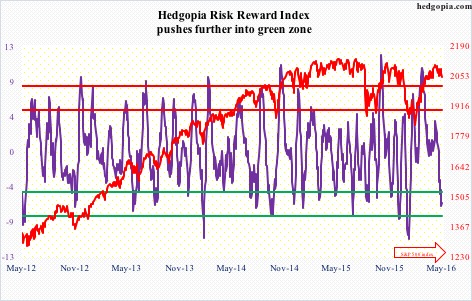
Hedgopia Risk Reward Index