The following are futures positions of non-commercials as of June 2, 2015. Change is week-over-week.
10-year note: Yields have decisively broken out of a five-month downtrend channel. The only question is what triggered this.
To quote the Beige Book: “The overall tone is slightly more pessimistic than we have seen in recent renditions of the Beige Book.” Translation: There are few signs of second-quarter rebound. Lael Brainard, Fed governor, suggested as much, saying economic data so far do not suggest that the U.S. will see a significant second-quarter rebound. Both events took place before Friday’s better-than-expected jobs numbers for May.
Here are two possible reasons for the 31-basis-point spike in the 10-year. (1) U.S. rates simply followed European rates higher. (2) Liquidity is a tricky thing. Major central banks have been flooding the system with liquidity, but we increasingly hear trading liquidity is not what it used to be. Hence the increased volatility in the bond market.
If the yield breakout sticks, (1) how would long Treasurys react when the Fed starts hiking (whenever that is), and/or (2) how long before higher rates begin to impact the consumer discretionary sector? This is probably not the reason why the IMF urged the Fed not to raise rates until 1Q16. Christine Lagarde is probably more motivated by global repercussions of higher U.S. rates, across emerging economies in particular.
Non-commercials got this week’s yield direction right, but also used this as an opportunity to cut back.
Currently net short 73.6k, down 9.9k.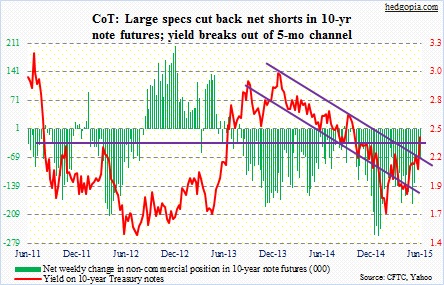
30-year bond: Once again, the 30-year yield rose off support – up 26 basis points for the week. Non-commercials showed indifference – essentially flat.
Next week’s economic calendar is a little light – relatively, that is.
Perhaps the most important release is retail sales for May, which comes out Thursday. This series has lost momentum of late – down four of the last five months month-over-month. April was $436.8 billion, down from $441.4 billion last November. Consumers have retrenched. Year-over-year, growth has been decelerating since last August – from growth of 5.01 percent to 0.88 percent in April.
In the wake of last Friday’s healthy payroll numbers, the JOLTS report for April, due Tuesday, has relevance. Job openings were 4.99 million in March, down from a peak of 5.14 million in the previous month. This series is only 11 eleven years old, but has shown a tendency to lead payroll. So it will be interesting to see whether or not the March drop was an aberration. Also in March, quits rose 2.78 million – a cycle high. People wanting to quit is a healthy sign as they would normally not quit until they have either lined up something or are feeling confident about job prospects.
Then on Tuesday, we have the NFIB small business optimism index for May. The cycle high was reached last December at 100.4. April was 96.9. Members’ capex plans have been stuck at 26 in three of the last four months. Comp plans reached 17 last December, matching October 2007, and has since declined; April was 14.
Friday is PPI for May. Producer prices dropped 0.4 percent month-over-month in April. This was the seventh drop in the last nine months. Year-over-year, prices fell 1.3 percent in April – third consecutive drop. Also Friday is the University of Michigan’s consumer sentiment. This is the preliminary estimates for June. May was weak, down 5.2 points from April to 90.7. In the first five months of 2015, it has averaged 94.6.
Currently net long 6.2k, down 2.2k.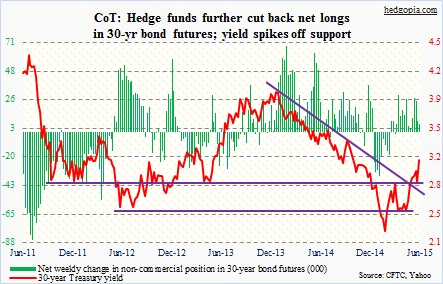
Crude oil: The 61.50-62 resistance proved too much for WTI bulls to conquer. That resistance has been in the making for the past month or so. OPEC did not help, as the cartel decided, as expected, not to reduce its 30 million barrels/day quota. But that decision came on Friday. And the WTI was already coming under pressure on Wednesday.
Once the attempt to rally past resistance failed on Tuesday, the daily overbought conditions took over. They were in need of unwinding. Weekly conditions are way overbought, and unwinding probably lies ahead. The 50-day moving average lies at 56.69, which was nearly tagged on Friday and attracted enough bids to close above support at 58; 54 is a must-hold.
Here is an interesting tidbit. Rates for Very Large Crude Carriers (VLCC) jumped to $80,000 a day in May. Jefferies estimates that approximately 14 percent of the global VLCC fleet has been locked up as floating storage for excess oil, with an estimated 186 million barrels sitting in the hulls of ships.
Non-commercials continue to remain optimistic.
Currently net long 374.4k, down 1.4k.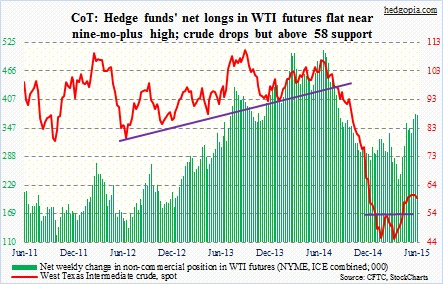
E-mini S&P 500: It was an interesting week. The S&P 500 only lost 0.6 percent for the week, but was in the midst of two important developments. First, the index lost its 50-day moving average, and on Friday sellers/shorts showed up near that level as soon as it was tagged intra-day. Secondly, on Wednesday the underside of the broken October 2014 trendline provided resistance. These were expected technical moves. It is now up to the bulls to regroup before the bears build momentum. On a weekly basis, conditions are overbought, and momentum indicators have already started turning lower.
Concurrently, daily conditions, which are now oversold, can potentially come to bulls’ rescue. Regional banks (KRE and regional-bank-dominated KBE) continue to act well. The Dow Jones Transportation Index rallied 2.5 percent this week, but will it able to further build on this momentum this week? It is currently sitting right underneath resistance. This could end up deciding the fate of the S&P 500.
Non-commercials seem to be anticipating a reflex rally. They cut back net shorts by 64 percent.
Currently net short 24.8k, down 44.4k.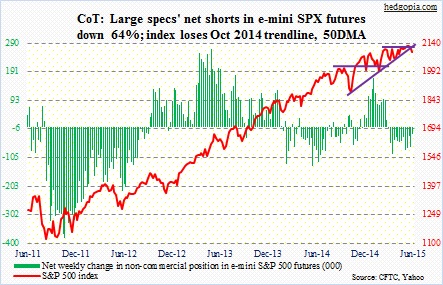
Euro: It is true eurozone macro data look a little bit better currently. A case in point: The annual inflation rate rose to 0.3 percent in May, after five months of falls or stagnation. But this cannot be the only reason why their rates shot up. Ten-year German bunds on Thursday were yielding 0.99 percent before backing off – up from 0.05 percent as early as April (closed Friday at 0.84 percent).
The bond market seems to be testing Mario Draghi’s, ECB president, resolve. On Wednesday, he did not sound like he was overly concerned by the spike in yields. Nor did he drop any hints that he is considering expansion of the ongoing QE. Rather, the ECB is front-loading, which means there will be less buying down the road. Another instance of markets trying to front-run a central bank? The bigger question is, are the big boys selling yet? Probably not. It does not show up in the volume. Should it ever occur, that will be Mr. Draghi’s nightmare.
Currently net short 165.5k, down 6.2k.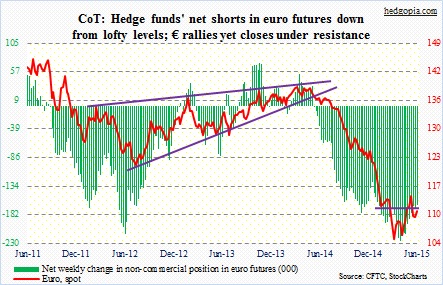
Gold: The metal simply came undone this week. Even a falling dollar did not help matters. It is possible the spike in interest rates took its toll. Spot gold has lost 1180 support, although not by much.
Gold bugs can find solace in the fact that GLD, the gold SPDR ETF, saw $902 million in withdrawals in May, yet gold rose 0.6 percent in the month. By the way, the ETF now has $27.4 billion in assets (courtesy of ETF.com). How the mighty have fallen! Back in the heyday (we have to go back to late 2011), it had $77.7 billion in assets. Briefly back then, GLD led all ETFs with the most assets, more than SPY, the S&P 500 SPDR ETF. The latter tops the list with $177 billion now.
Currently net long 104.4k, down 0.284k.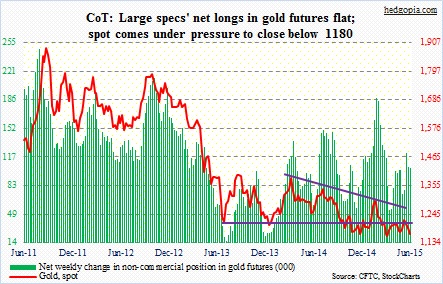
Nasdaq 100 index (mini): The index came under slight pressure in the week, and is essentially sitting on support (4480). The 50-day moving average is less than two percent away. Should a test take place, daily conditions will probably be oversold by then. On QQQ, the PowerShares QQQ Trust, the 50-day average is less than a percent away, so it is possible it will end up providing support. Depending on how it trades early in the week, QQQ could very well be shaping up as a candidate for bull put spread or cash-secured put. One caution: The ratio of QQQ to SPY, which started rising mid-May, has gone sideways to down this month.
Non-commercials raised net longs to a five-week high.
Currently net long 68.3k, up 19.1k.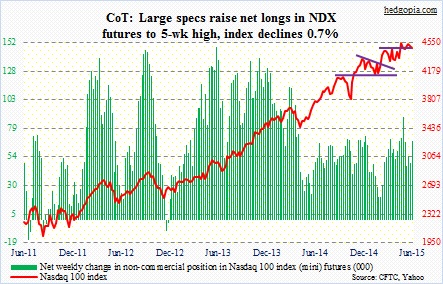
Russell 2000 mini-index: Small-caps continue to lead large-caps. IWM, the Russell 2000 iShares ETF, has been leading SPY for the past month, outperforming with a spread of 1.8 percent during the week. Having said that, the index is still below its mid-April high, and has straddled the 50-day moving average for the last several sessions. It has also broken its October 2014 trendline. Probably the reason why non-commercials are staying with their net shorts. With that said, the index also managed to successfully test support at 1215 five weeks ago. If it can further build on that momentum next week, there is room for weekly momentum indicators to continue to turn up.
Currently net short 29.5k, down 3.1k.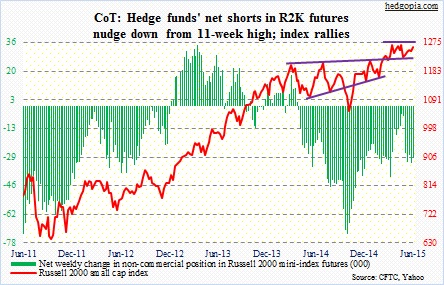
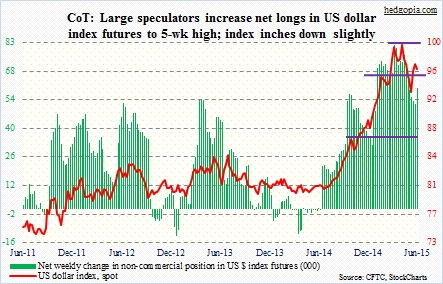
U.S. Dollar Index: For the first time in seven weeks, non-commercials added to net longs. These traders have done a good job of getting the trend right. Or is it a self-fulfilling prophecy? Whatever the case, it is worth remembering that the index peaked mid-March, and a week before that their net longs peaked. So if they are adding now, is there a signal here? Too soon to say, but suffice to say that in a week in which long U.S. rates spiked, the dollar index lost 0.6 percent.
Currently net long 59.7k, up 7.4k.
VIX: One wonders if it can ever push through 15. Just this week alone, spot VIX attempted to break through that level in three different sessions, but could not close above it. The price point has provided resistance since at least April. It is an important area, marked by both its 200-day moving average and a declining mid-October 2014 trendline.
Non-commercials are betting the status quo remains. Some option traders beg to disagree. Mid-week, there were a couple of big upside call trades.
Currently net short 70.3k, up 3.3k.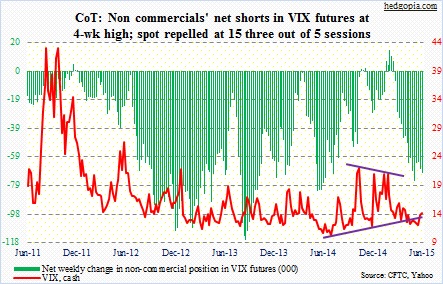
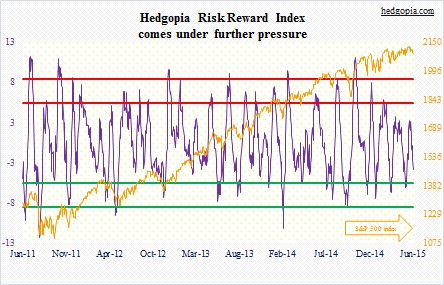
Hedgopia Risk Reward Index